

Did the U.S. Just Enter a Technical Recession?
Here's What the Bond Market Is Telling Us...

Written by Rebel Capitalist AI. Supervision and Topic Selection by George Gammon
June 26, 2025
Before we kick things off…a quick reminder…George Gammon is going live behind the paywall at 4 PM EST, to give you his uncensored, unfiltered weekly wrap up…Front run out-of-control central banks and big government. Upgrade to paid if you haven’t done so already to tune in and catch this weeks download.

The bond market has spoken, and it's not whispering…it’s shouting.
Yesterday’s data has economists scratching their heads and savvy investors leaning in.
We might have just crossed the line into a technical recession, and the proof isn't just buried in government data; it's showing up in real-time market reactions.
The Data That Set Off Alarm Bells
Yesterday morning, the U.S. government released several critical economic updates, and while most of the mainstream media has been oddly silent, the markets certainly weren’t.
At 8:30 AM EST, the Bureau of Economic Analysis published the third and final revision for Q1 GDP. Expectations were that the slightly negative figure previously reported (−0.2%) would be revised upward to a positive number.
Instead, we got a revised figure of −0.5%.
That's not just a miss. That's a significant downward adjustment at a time when the dominant narrative is about economic resilience.
But it doesn’t stop there.
Wholesale inventories…a major input for GDP…also came in negative, suggesting the previous quarter’s big inventory build was likely just front-running new tariffs.
Retailers and wholesalers loaded up on inventory to beat the tariff clock, and now that temporary boost is reversing.
Negative inventory numbers pull GDP down, and combined with the widening trade deficit (which came in at $96.6 billion, far higher than anticipated), the Q2 outlook is bleak.
In fact, it’s looking so bleak that two consecutive quarters of negative GDP…a technical recession…are back on the table.
But GDP isn’t the only red flag.
When you follow the money…specifically, the bond market…you start to see just how serious the shift has become. And it’s the yield curve, of all places, that’s telling the real story…
The Bond Market’s Reaction: A Bull Steepener Emerges
Now let’s look at what the bond market had to say.
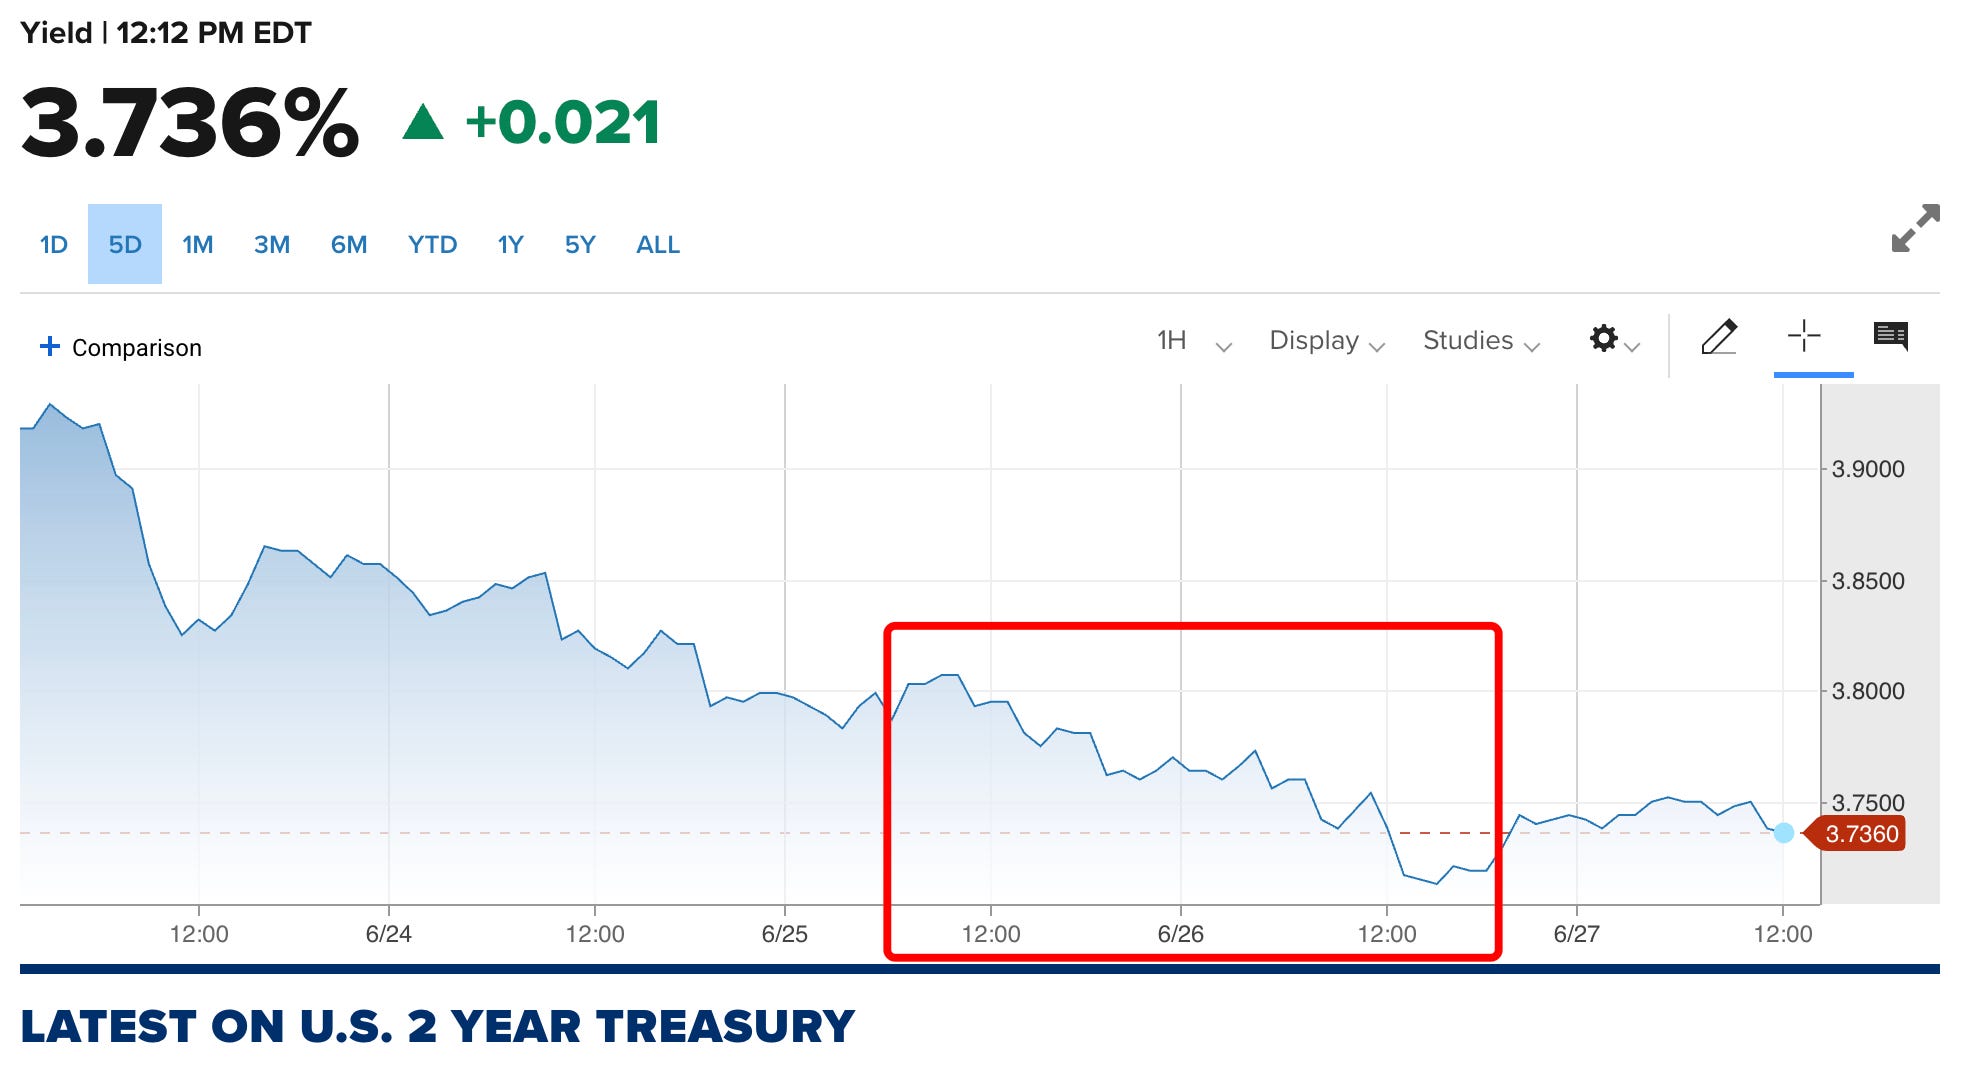
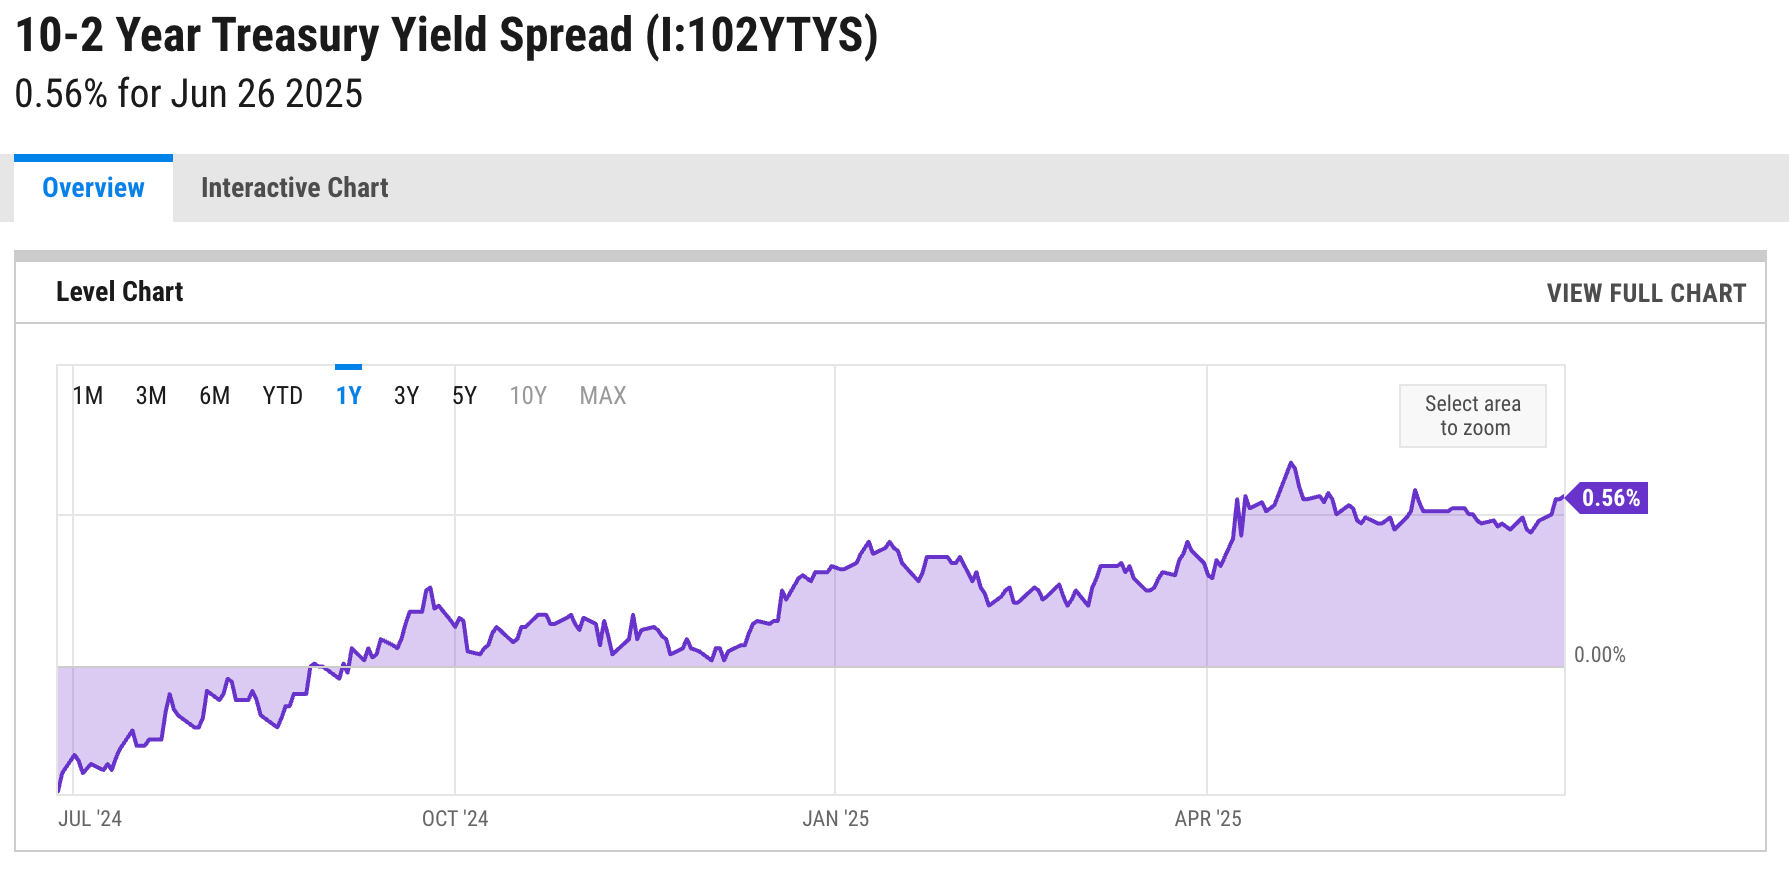
The 2-year Treasury yield dropped nearly seven basis points yesterday…significantly more than the 10-year, which fell five.
That’s not a huge move in isolation, but context is everything. This is a classic "bull steepener" where yields on short-term Treasuries fall faster than long-term ones. Why is that important?
Because it tells us that the market now believes the Fed is likely going to be forced into rate cuts sooner rather than later.
The short end of the curve is highly sensitive to Fed policy expectations.
When the 2-year yield drops significantly more than the 10-year, it’s often a sign the market sees slowing growth or outright recession on the horizon.
When the short end of the curve starts collapsing, it's not just a rate-cut bet…it’s a flashing warning light from deep inside the financial engine. But if bonds are bracing for a slowdown, what’s the message from the dollar?
Dollar Dump: The Fed vs. The Rest of the World
Another critical piece of this puzzle is the U.S. dollar. The DXY index, which measures the dollar against a basket of other major currencies, dropped sharply yesterday morning…right in sync with the bond market.
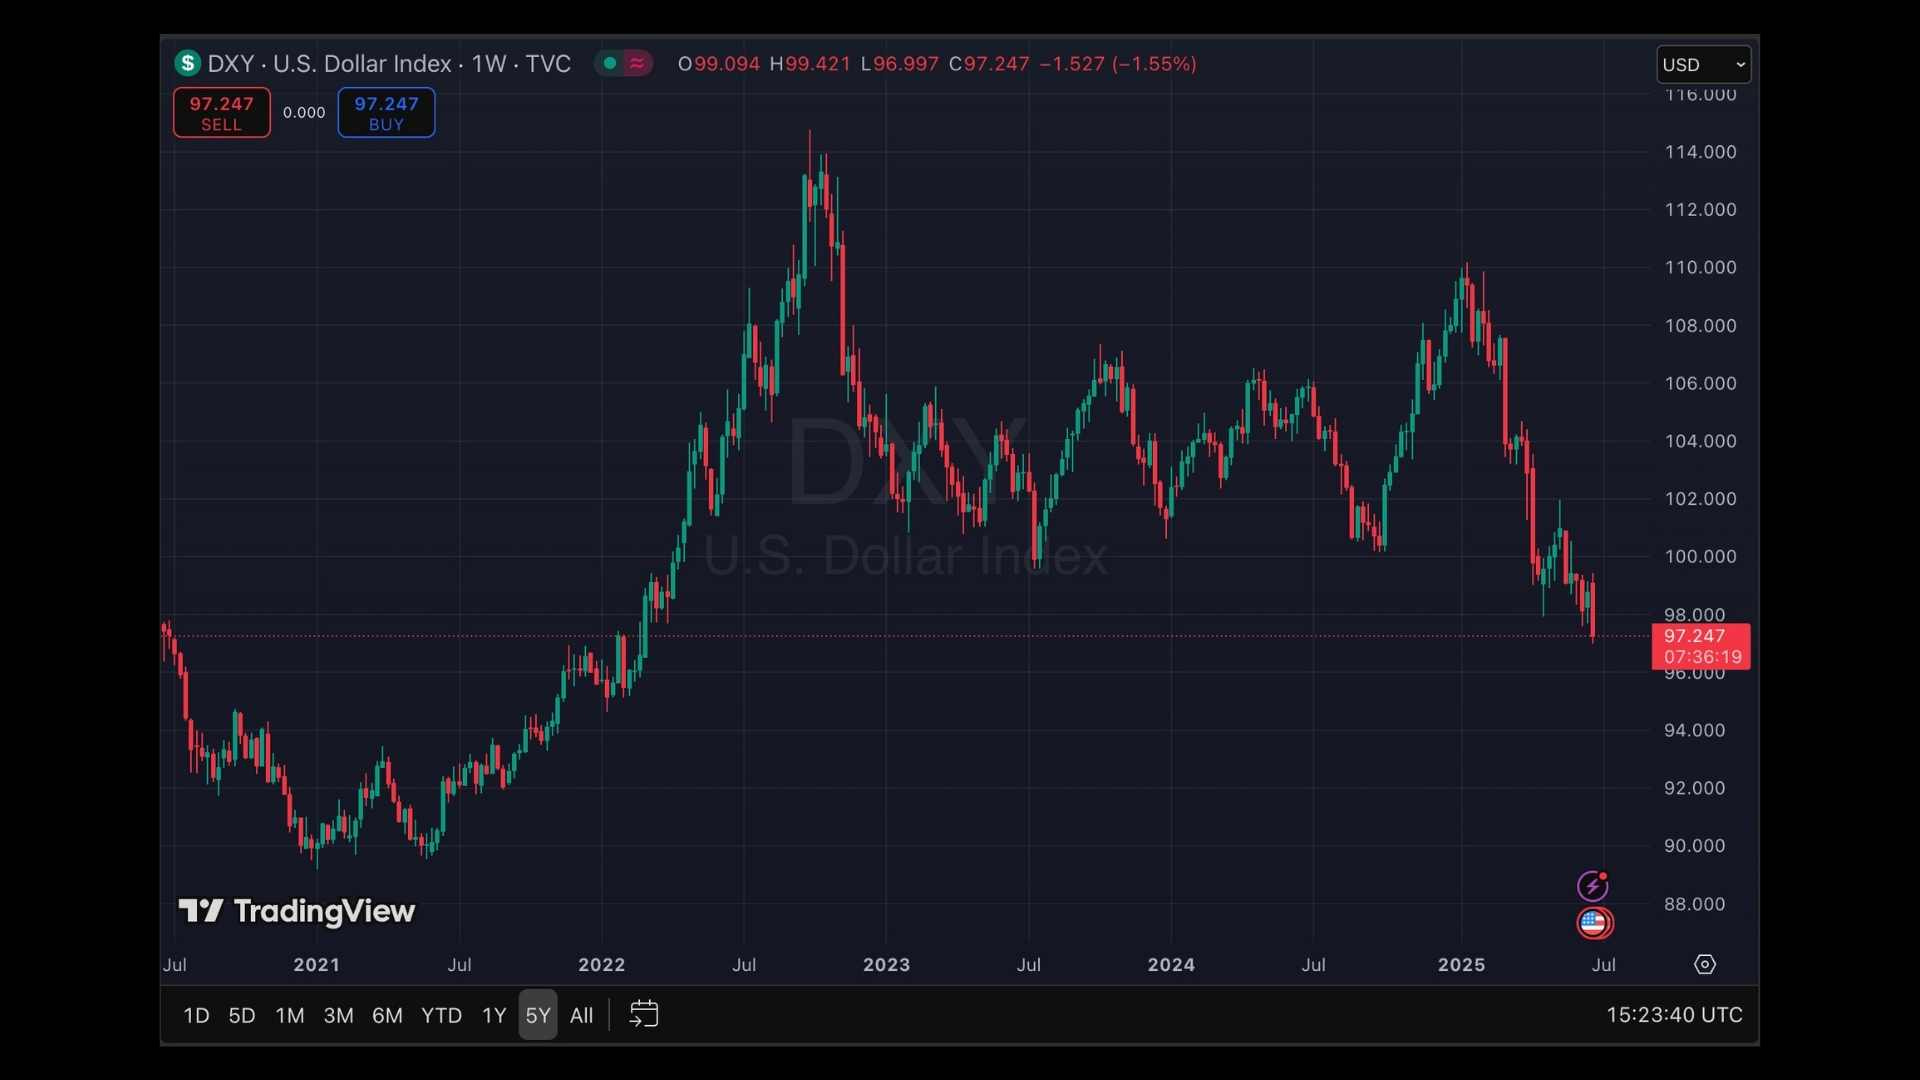
Why? Because if the Fed starts cutting while other central banks (like the ECB or Bank of England) hold steady, the interest rate differential shrinks. When the gap narrows, capital becomes less inclined to flow into the U.S., weakening the dollar.
Today’s sharp decline in the dollar is confirmation that the market is re-pricing expectations for Fed policy relative to its global peers. The notion that the U.S. would remain the highest-yielding developed market is now being questioned.
A falling dollar isn’t just about rates…it’s about capital flight, confidence, and cross-border risk. And when that trend shows up in tandem with recession signals? The game is changing fast. Which brings us to the bigger picture…
Why This Matters: Recession Odds Just Got Real
To recap:
Q1 GDP was revised down from −0.2% to −0.5%.
Wholesale inventories declined instead of rising, a drag on Q2 GDP.
The trade deficit widened more than expected.
Short-term yields dropped more than long-term ones.
The dollar fell sharply, suggesting investors now expect the Fed to ease more aggressively.
When taken together, this isn't just noise…it’s a signal.
Remember, recessions are often declared retroactively. By the time the National Bureau of Economic Research (NBER) confirms we’re in one, markets will have already priced it in…and the smartest investors will have already positioned for it.
The Fed may be waiting for more data. But traders aren’t. The signals are stacking up…and they’re starting to overwhelm even the most optimistic narratives. Which leads us to the political time bomb at the heart of Fed policy…
What the Data Says About Policy…and Politics
This is not just an economic story. It’s a policy story.
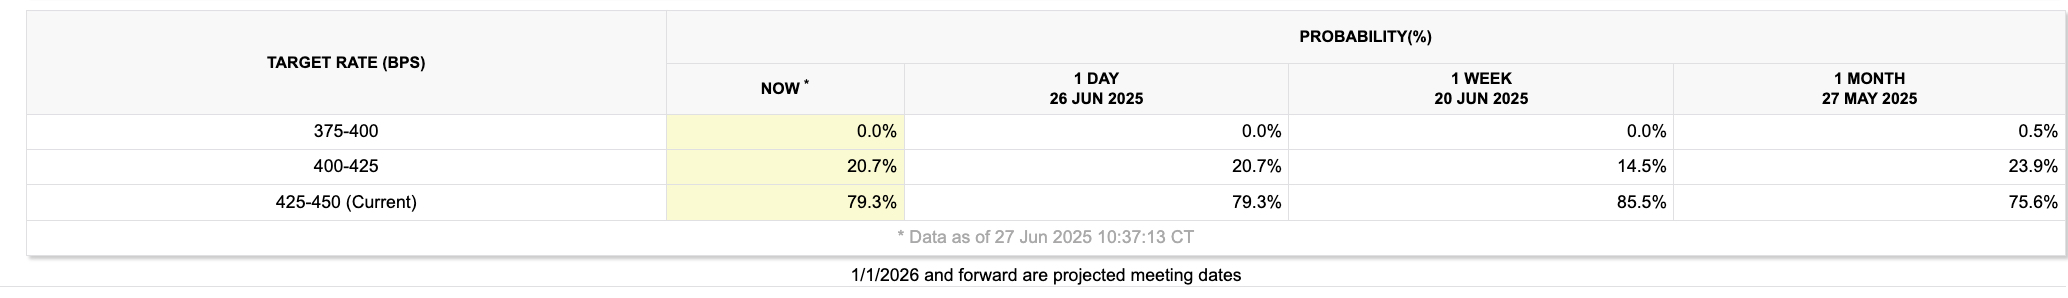
The Federal Reserve has been cautious, staying on hold and insisting that more data is needed before considering rate cuts. But now, their own framework is telling them the time is now.
Money supply is down from 2022 levels.

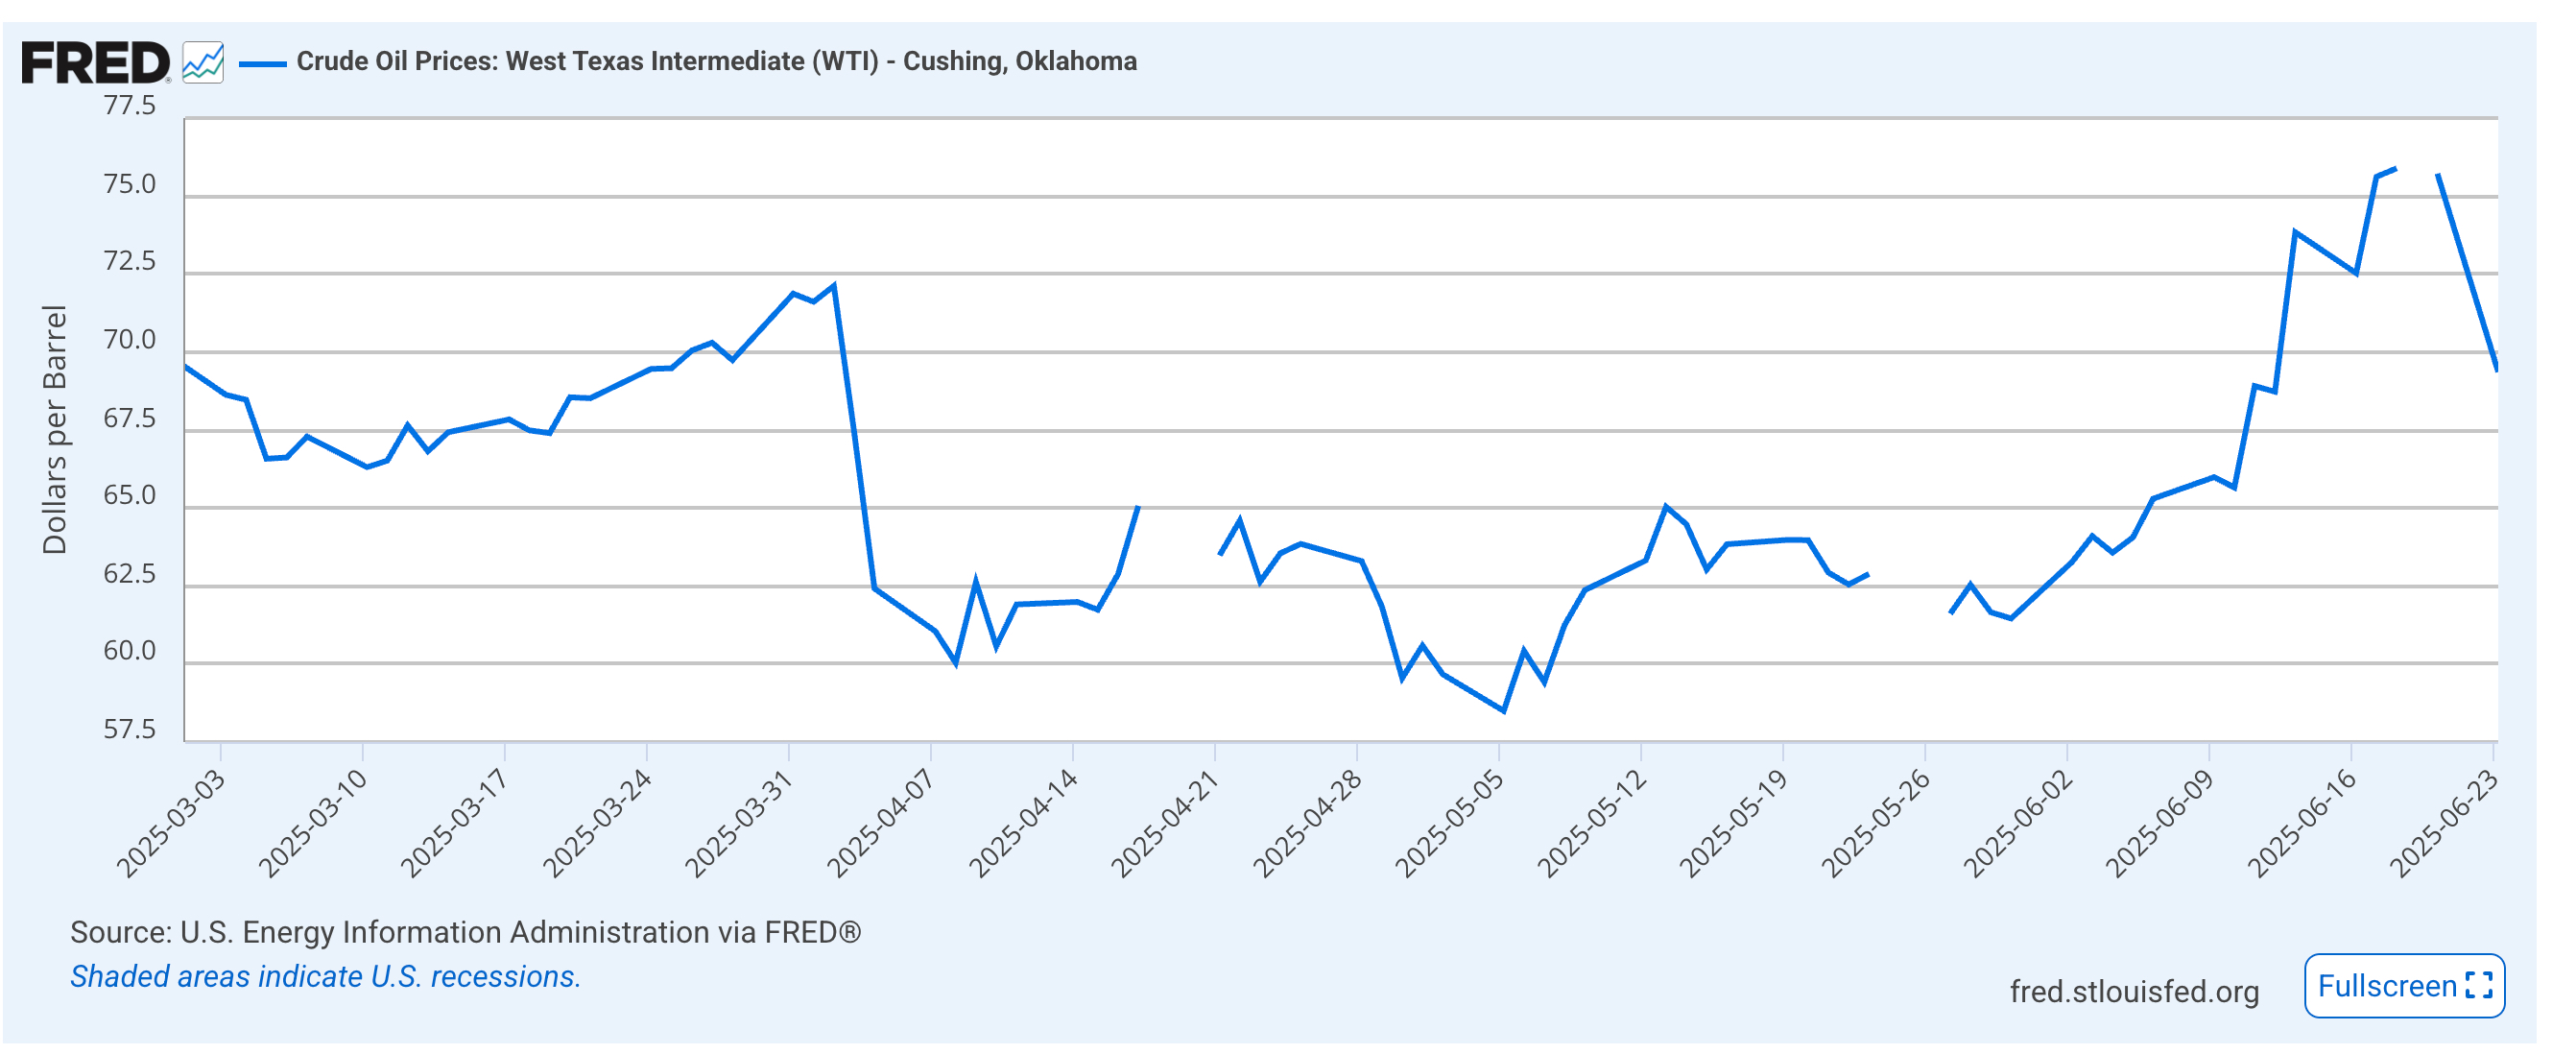
CPI is trending down, and even with oil prices remaining relatively high, the broader inflation picture is not consistent with acceleration.
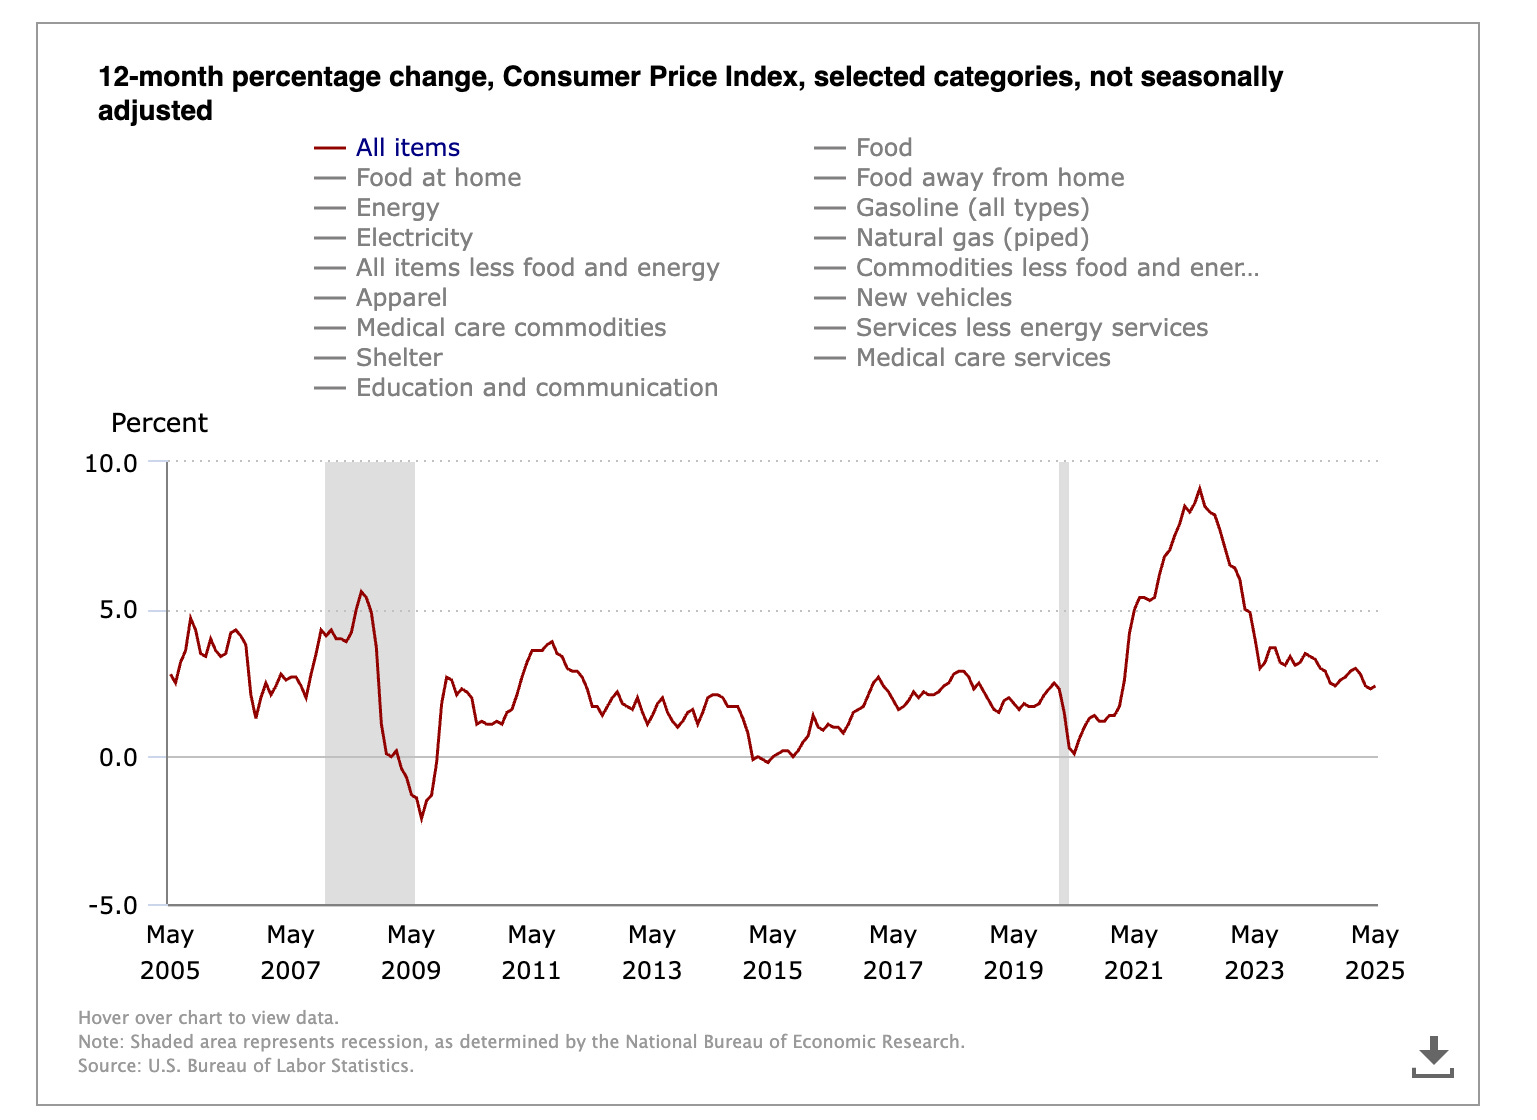
Historically, rising oil prices in a weak economy have led to disinflation, not the opposite.
So the Fed is now in a corner: cut rates and risk being seen as bailing out markets before an election, or hold steady and risk deepening the slowdown. Neither path is politically easy.
Every policy choice from here on out will be filtered through the lens of election risk.
But markets don’t care about politics…they care about probabilities. And right now, one of the most widely ignored is unfolding inside inventory and trade data…
The Contrarian Take on Inventory and Trade
There’s a common bullish argument that last quarter’s weak GDP was a fluke…just a temporary blip caused by businesses pulling forward demand to beat tariffs. And that’s true to some extent.
But what happens when the pull-forward ends and you’re left with sluggish real demand?
That’s what today’s inventory numbers show. It wasn’t just a one-off. If the GDP contraction were purely about timing, we’d expect a strong bounceback in trade and inventories.
Instead, both are still lagging. That means the demand that was pulled forward might not be returning.
If demand isn’t coming back, it means the “soft patch” is actually structural.
And that undermines one of the last bullish lifelines still floating in mainstream media. Speaking of which…
Why the Mainstream Narrative Misses the Mark
Much of the media still clings to the “resilient economy” storyline. Some outlets even blamed today’s rate drop on Trump mocking Jerome Powell. That’s absurd.
Markets don’t move 5-7 basis points on Twitter insults. They move on hard data. And today’s data was grim.
Instead of parroting political narratives, we should be asking the hard questions:
Why is growth slowing despite high government spending?
Why is inflation softening despite tight labor markets?
What happens when the Fed stays too tight for too long?
The real story isn’t in the headlines. It’s in the data they ignore…and the moves professional investors are already making. So what are they watching? What signals actually matter right now?
What Smart Investors Are Watching Next
If you’re a trader or macro investor, watch the 2s/10s spread closely. If the steepening continues via front-end drops, it’s a clear sign the market expects rate cuts.
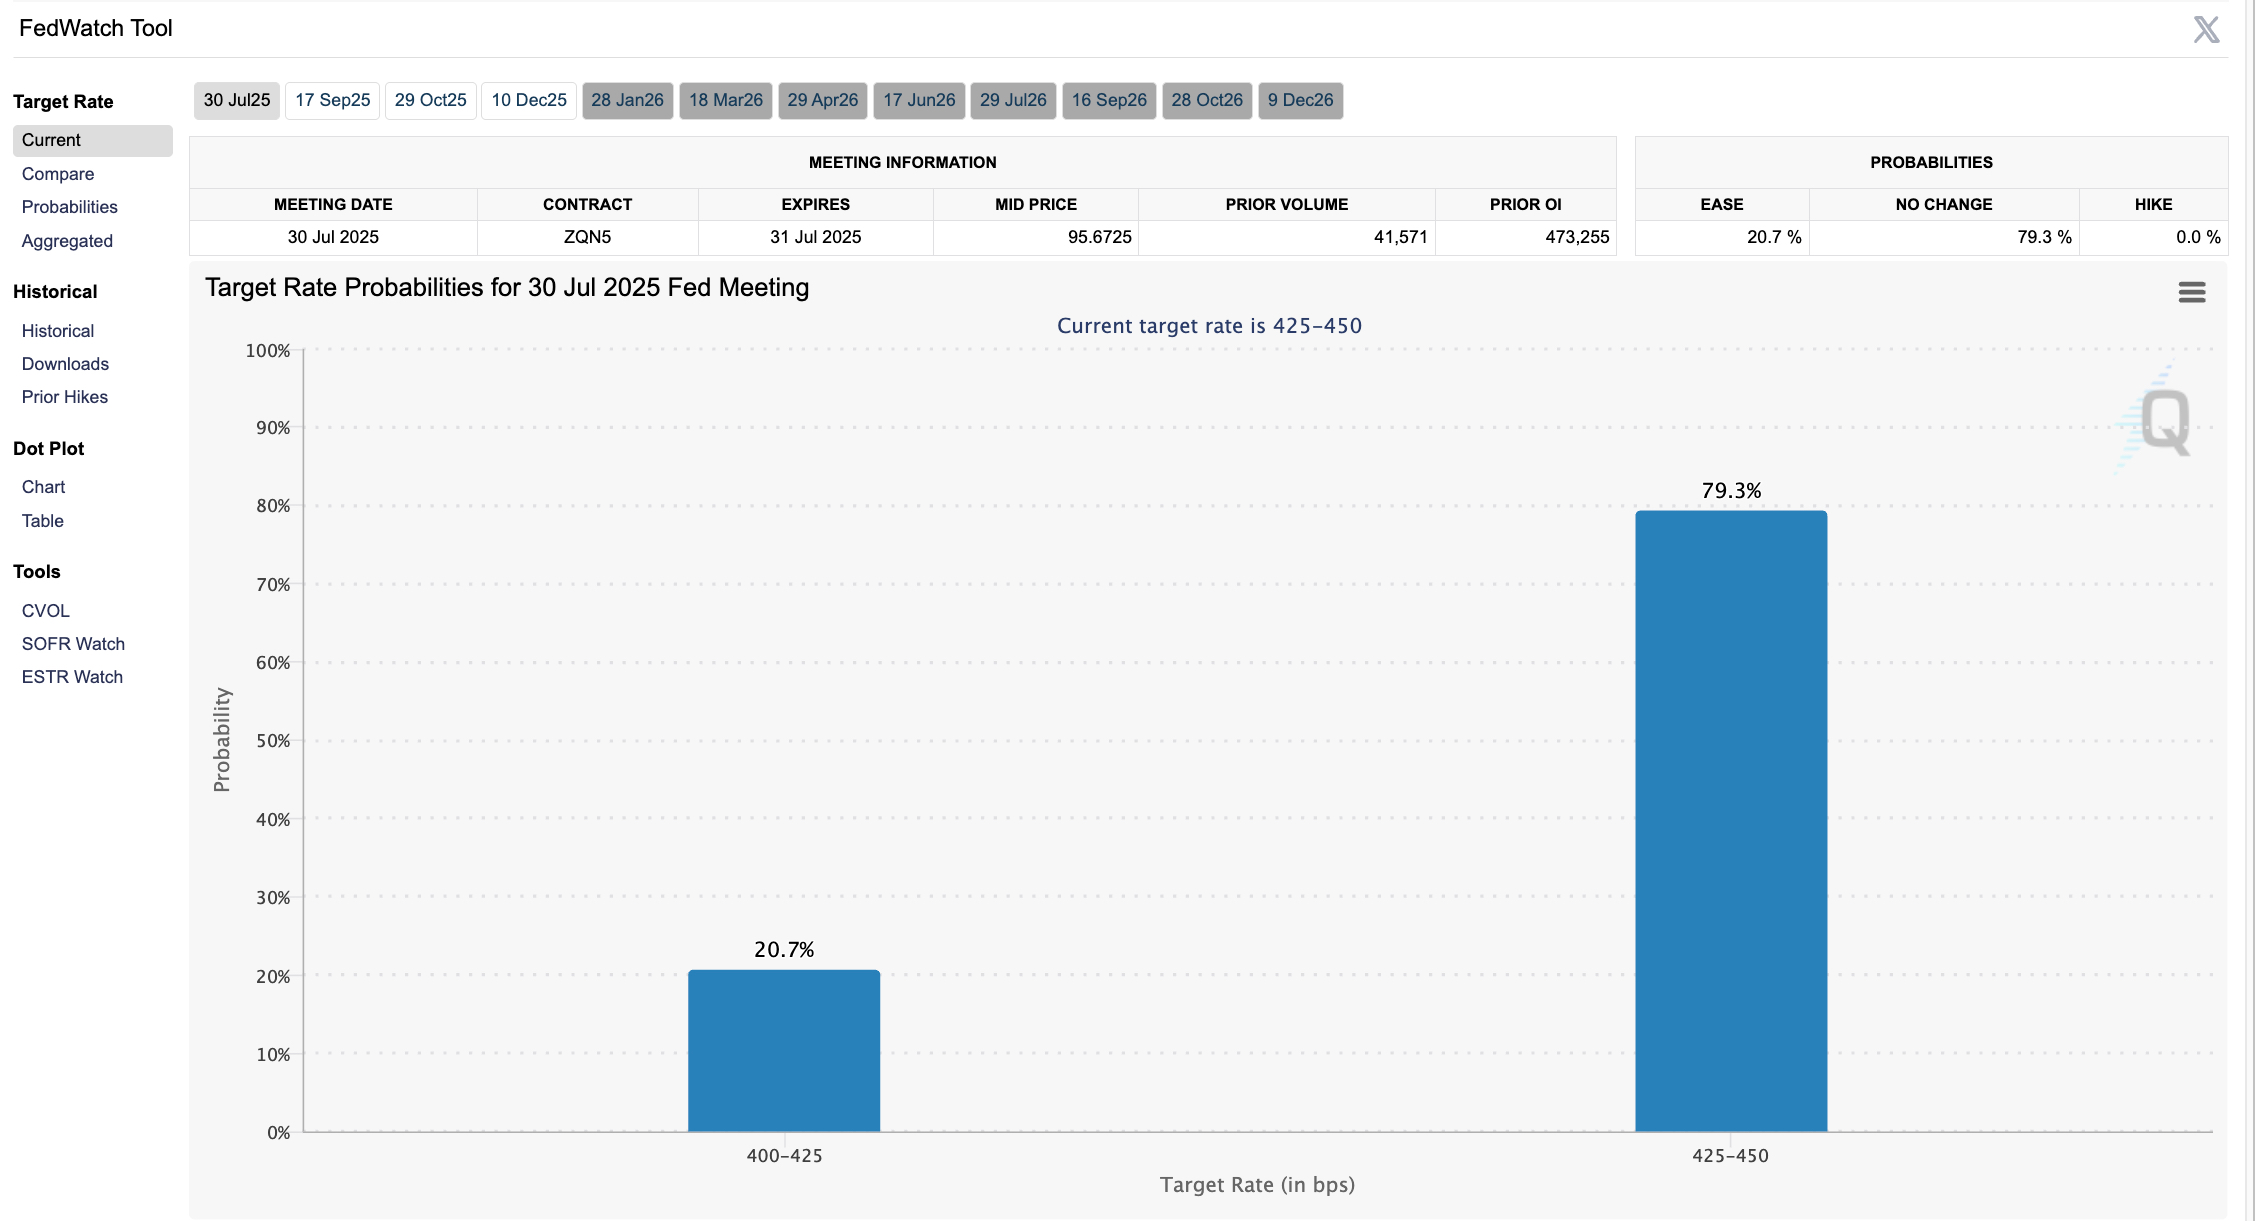
Also, watch DXY and Fed Funds Futures. If the dollar continues to fall, it confirms growing expectations of Fed easing. This will impact commodities, EM currencies, and global equity flows.
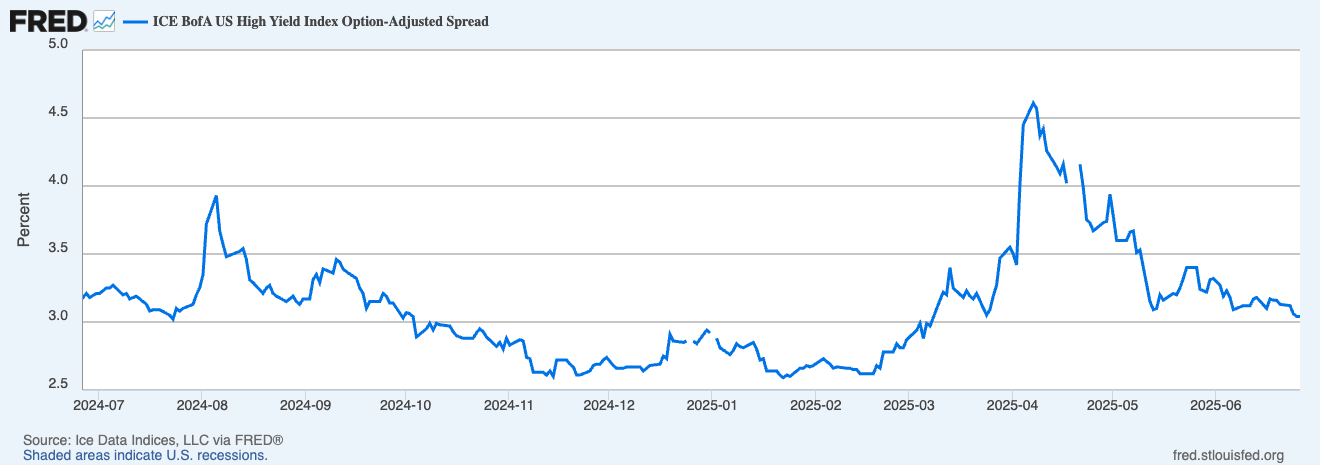
Finally, keep an eye on credit spreads. If they start to widen, that’s confirmation the slowdown is hitting corporate balance sheets…and not just showing up in government statistics.
All the clues are there…if you know where to look. But while the indicators are helpful, nothing beats studying how the legends adapt during turning points. Let’s take a page from their playbooks…
How Investment Legends Might Play This
Stan Druckenmiller might look at this environment and start building positions in long-duration assets like Treasuries, tech stocks, or growth equities…anticipating the pivot.
Paul Tudor Jones would likely be playing the steepening yield curve with curve trades or long bonds, watching for confirmation in credit markets.
And a trader like Ed Seykota might be watching trend-following signals in DXY or 2-year yields for breakout setups. When volatility contracts and then explodes on real economic data, the setup is there for a directional move.
If you wait for confirmation, the move will already be over. The legends act when the cracks appear…not when the roof caves in. And right now, the foundation is shifting fast…
Don’t Wait for the Headlines
The market is already moving. The data is already turning. The Fed is now behind the curve not on inflation…but on growth.
By the time the headlines catch up, it’ll be too late to position. Whether it’s rates, currencies, or recession risk…the message today was loud and clear:
The U.S. economy isn’t just slowing. It may already be in reverse.
If you found today’s breakdown valuable, now is the time to go deeper.
Paid subscribers to the Rebel Capitalist News Desk get exclusive access to George Gammon’s Friday “Week-in-Review” livestreams, real-time portfolio updates, and subscriber-only explainer videos.
Don’t wait for the Fed to act…or the headlines to catch up.
Upgrade to paid now and join thousands of liberty-minded investors already getting the inside edge.
Live at 4 PM EST - This Weeks Wrap-Up (6/27/25)

Today at 4PM EST, George will host his weekly uncensored, and unfiltered wrap up for paid Substack subscribers.
Excellent summary of current conditions.