

PPI Goes Negative
What It Means for the Fed, CPI, and Your Portfolio

Written by Rebel Capitalist AI | Supervision and Topic Selection by George Gammon | September 13, 2025

The Producer Price Index (PPI) came in negative this week — yes, negative.
That one data point could end up changing the trajectory of Federal Reserve policy, market expectations, and even how investors should be positioning right now.
For months, the mainstream narrative has been stuck on stagflation, warning that inflation was about to surge again.
But today’s numbers show something very different…and when you put them in the context of bond yields, labor market revisions, and gold’s behavior, the picture gets even clearer.
The Shock: PPI Goes Negative
The Bureau of Labor Statistics reported that PPI for August declined −0.1% month over month, versus expectations of a +0.3% increase.
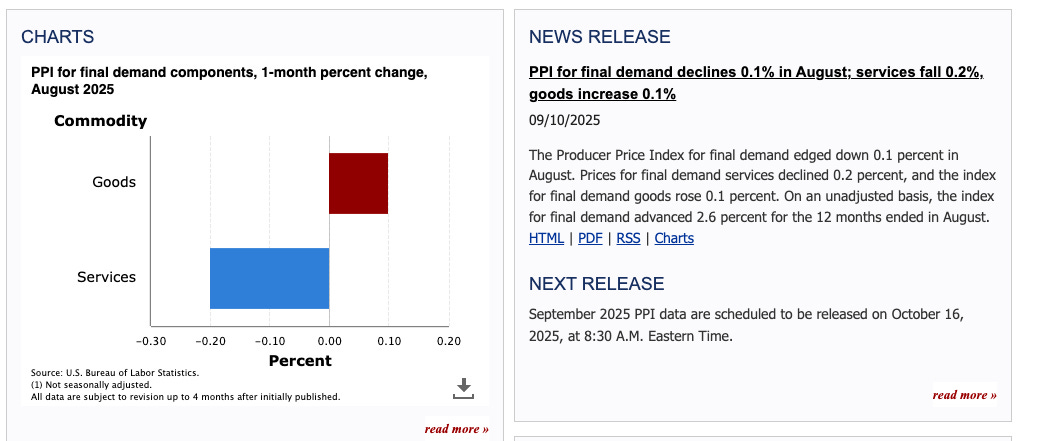
Breaking it down:
Final demand for services: down −0.2%
Final demand for goods: up +0.1%
Core PPI (ex-food & energy): still positive at +0.3%, but not enough to offset the shock headline.
This is a huge miss compared to last month’s +0.7%. In other words, we went from one of the hottest prints of the year to outright contraction in just 30 days.
For anyone still chanting “stagflation,” the data doesn’t add up.
History shows that when unemployment rises and the labor market softens, inflation doesn’t accelerate…it decelerates.
Even in the 1970s, recessions brought disinflation, not spiraling CPI.
What looks like a one-off data blip is actually the first crack in the stagflation narrative.
But the real question is: if PPI can swing from the hottest print of the year to outright contraction in just 30 days, what does that mean for Fed policy?
Why It Matters for the Fed
Up until recently, Wall Street consensus was that the Fed would either:
Deliver a 25 bps cut, or
Pause and wait for more data.
A 50 bps cut wasn’t even on the table.
But this weeks negative PPI changes that. The CME FedWatch tool has barely adjusted, still showing only ~10% odds of a half-point cut. But that could change dramatically after the CPI print.
If CPI follows PPI lower…and history says it probably will…then the probability of a 50 bps cut rockets higher.
The market still thinks a half-point cut is “impossible.”
Yet history shows the Fed almost always follows the market, not the other way around. As of this writing, the only missing piece? CPI.
And if it mirrors PPI, consensus expectations could be obliterated overnight.
The PPI–CPI Connection
Brent Donnelly on The Macro Trading Floor podcast recently pointed out something fascinating: usually CPI comes first, but this month PPI was released a day early. Historically, when PPI misses big to the downside, CPI follows in the same direction.
If that correlation holds, tomorrow’s CPI could also come in well below expectations (currently pegged at +0.3%). There’s even an outside chance it prints negative.
And if CPI is negative, Fed probabilities aren’t just going to drift…they’re going to explode toward a 50 bps cut.
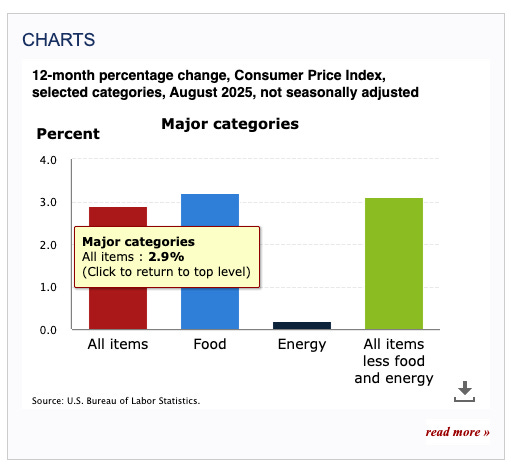
UPDATE: CPI came in as expected 2.9% and rates dropped.
The Bond Market Is Already Pricing It In
Forget the Fed’s rhetoric. Forget the CME probabilities. The bond market is already sending a loud signal.
2-year yield: 3.56%
Fed Funds Rate: 4.33%
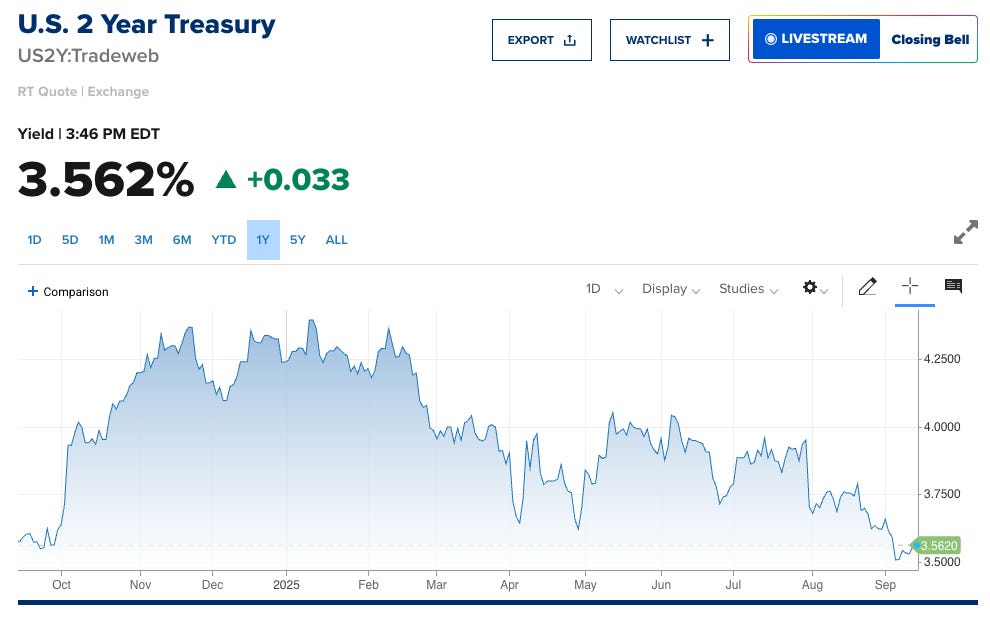
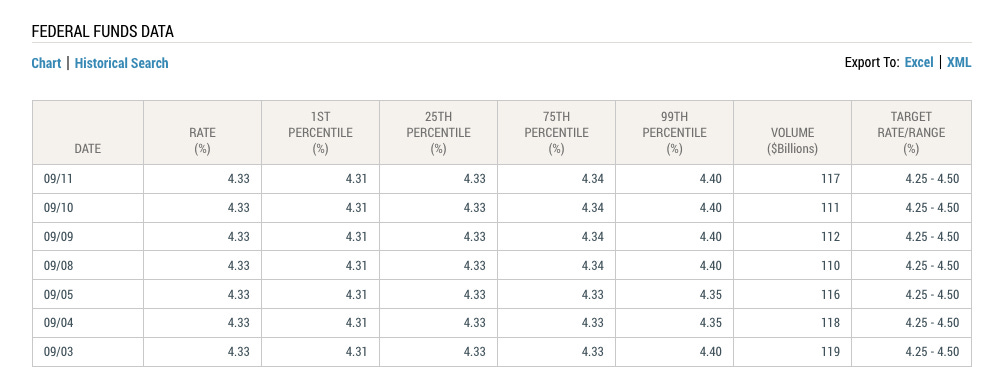
That’s an 80 bps gap. Even if the Fed cuts by 50, it still won’t have caught up with where the market already is.
History is clear: the 2-year leads, Fed Funds follows.
We saw it before the dot-com crash, before the GFC, and during the COVID crisis. Every time the 2-year starts falling hard, the Fed eventually follows.
The only question is whether Fed Funds “meets” the 2-year by cutting…or whether the 2-year shoots back up.
Given the recessionary signals everywhere else, betting on the Fed cutting is the higher-probability outcome.
The 2-year yield is screaming that cuts are coming. But while bonds are flashing red, currencies are flashing something else entirely.
The dollar is quietly rolling over…and that’s a development with global consequences.
The Dollar Dump
DXY has been sliding in sync with falling yields. That’s no accident.

If the Fed cuts while the ECB, BoE, or even the BoJ hold steady, the interest rate differential narrows. Capital flows shift, and the dollar weakens.
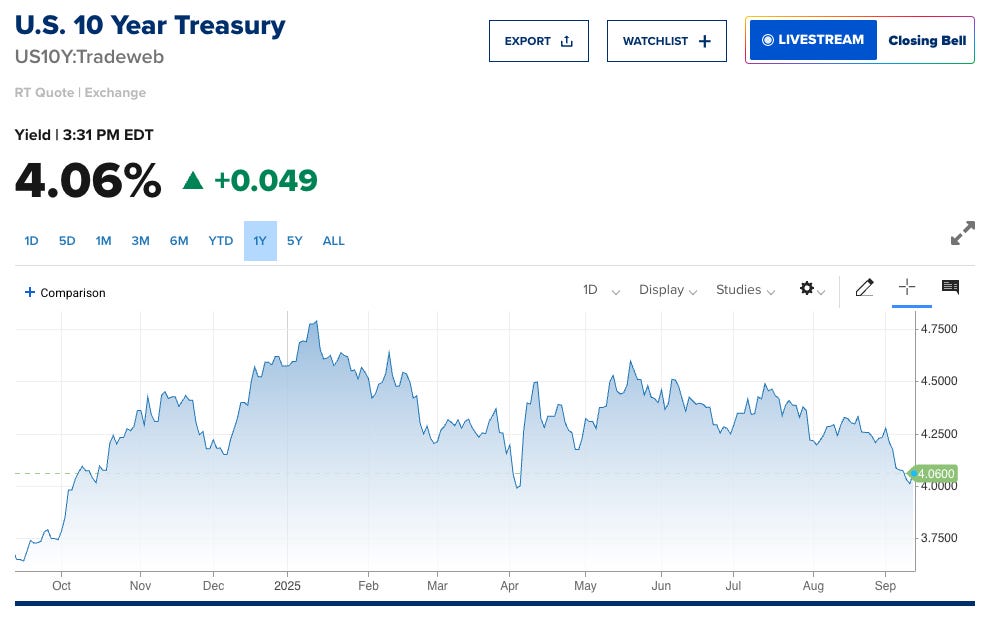
This isn’t stagflation pricing. If we were in a true stagflationary environment, the 10-year yield would be screaming higher…not drifting toward 4%.
If the dollar continues to weaken, it won’t just be a chart pattern…it’ll be a signal that international capital has lost faith in U.S. policy.
And when that happens, the stagflation narrative doesn’t just look wrong. It looks dangerous.
The Stagflation Myth vs. Reality
For months, analysts have been warning about stagflation. But the mechanics don’t support it.
If wages aren’t rising, consumers can’t sustain accelerating inflation.
If unemployment spikes, demand falls further.
If oil rises in a weak economy, it acts like a tax — pushing demand down and leading to disinflation, not runaway CPI.
This isn’t just theory. Look at the 1970s recessions. Look at 2008, when oil hit $130. Look at 2020. Every time the labor market collapsed, inflation fell…regardless of commodity spikes.
Every historical parallel points to the same outcome: recessions crush inflation.
Which means the real playbook for investors isn’t about fighting runaway prices… it’s about bracing for what comes next in jobs, bonds, and gold.
What Smart Investors Are Watching Next
CPI print tomorrow — this is the big one. If it comes in below expectations, the 50 bps cut narrative will move from fringe to consensus.
Initial jobless claims — projected at 235k. Combined with last week’s million-job downward revision, this could be another flashing red light.
The 2-year vs. Fed Funds spread — as long as the gap stays wide, cuts are coming.
Gold and miners — remember 2008–09: gold hit all-time highs even while the economy was in disinflation and even brief deflation. It’s not just about inflation; it’s about confidence in the system.
Jobs, CPI, the 2-year spread, and gold. Each one is a puzzle piece…but put them together and you get a picture that few in the mainstream are willing to admit.
And that picture brings us to the one asset that keeps breaking out despite falling inflation: gold.
Gold: The Wild Card
Gold has been breaking out, and history suggests it could keep going even if CPI trends down.

During the GFC, gold hit all-time highs while CPI rolled over and even went negative for a quarter. Why? Because gold isn’t just an inflation hedge…it’s a confidence hedge.
The risk is a short-term dip if we get a liquidity crunch, like in late 2008. But once liquidity normalizes, gold tends to lead the recovery.
For investors, that means don’t write off gold just because inflation cools. Its role as a hedge against systemic stress may be more important than its role as an inflation hedge.
Gold doesn’t just hedge inflation…it hedges trust in the system itself.
Which is why, when everyone else is staring at CPI prints, the smart money is quietly watching how the legends are positioning.
How Investment Legends Might Play This
Stan Druckenmiller: loading up on duration, going long Treasuries and high-quality growth stocks.
Paul Tudor Jones: trading the steepener — long 2s, short 10s — and watching commodities for confirmation.
Macro trend followers: keying in on DXY weakness and 2-year yield breakouts for long directional bets.
Druckenmiller, Tudor Jones, and trend-followers aren’t waiting for the Fed to tell them what to do…they’re already moving.
The only question left: are you watching the narrative, or the data?
Final Thought: Watch the Data, Not the Narratives
The big takeaway:
PPI is negative.
CPI is likely to follow.
The Fed is behind the curve.
The bond market is already screaming for cuts.
Ignore the stagflation noise. The real story is disinflation colliding with a weakening labor market…the exact setup that forces central banks to pivot.
The Fed may not want to admit it yet, but markets are already making the call.
The investors who survive this next phase won’t be the ones parroting mainstream headlines. They’ll be the ones who read the data for what it is, positioned ahead of the pivot while everyone else is still debating yesterday’s narrative.
If you found this breakdown valuable, don’t stop here. Join the thousands of liberty-minded investors who follow the Rebel Capitalist News Desk for frequent insights the mainstream won’t touch.
And remember: George Gammon goes live every Friday for his Weekly Wrap-Up. This is a premium feature that you will not see outside the paywall.
Premium subscribers get it unfiltered…with real-time charts, and George’s take on what these numbers really mean.
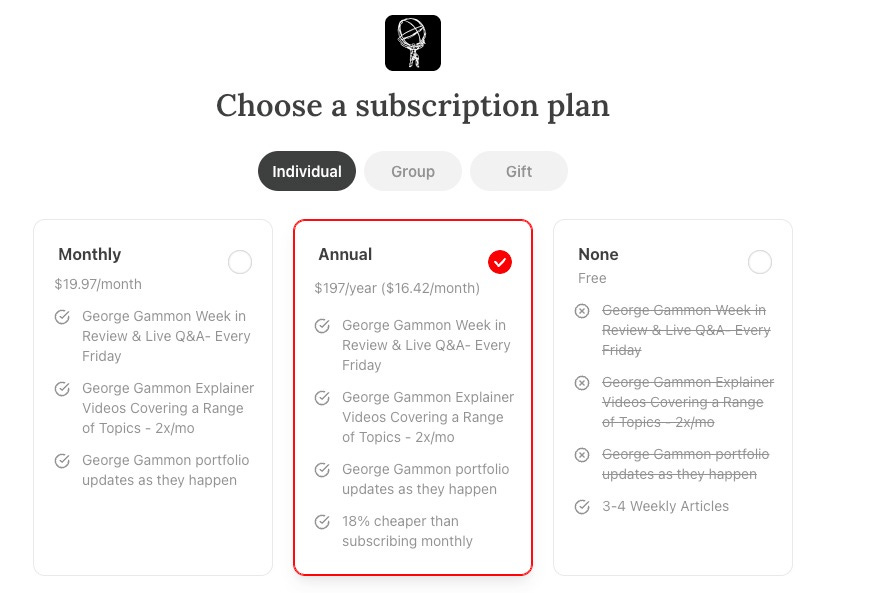
👉 Don’t miss it. Subscribe to the Rebel Capitalist News Desk on Substack today… upgrade now to catch the live Weekly Wrap-Up (or replay) and get the edge before Wall Street’s narrative machine even knows what hit it.