



![[Section Divider Image]](https://substackcdn.com/image/fetch/$s_!JoIB!,f_auto,q_auto:good,fl_progressive:steep/https%3A%2F%2Fsubstack-post-media.s3.amazonaws.com%2Fpublic%2Fimages%2F72be2eb6-12fe-47bd-8353-c38a62b024ab_1320x50.webp "[Section Divider Image]")
On Wednesday the Treasury Department announced it was at least doubling the size of its buyback operations in the long end of the bond market, meaning the bonds that do not mature for ten, twenty or thirty years. Yields fell. The ten-year dropped six basis points, a basis point being one hundredth of a percentage point. The thirty-year dropped nine.
By Friday both were higher than before the announcement.
That is the week in miniature, and the explanation is not the one being offered. It is not that the bond market is finally scared of the debt, though the debt did cross forty trillion dollars on Tuesday. It is not that intervention never works.
It is that the data this week was hot, and almost nobody said so out loud.
Empire State manufacturing nearly doubled the forecast. The Philadelphia Fed survey printed its highest reading since April 2021 against a forecast half its size. Friday’s flash composite PMI hit a 52-month high. Jobless claims fell. Target beat and raised.
Walmart raised too, and that one is not what it looks like. More on it below, because the way it broke is the most useful thing that happened all week.
Strong data plus fifty-percent oil is not a case for lower long rates. It is the opposite. Which is why a Treasury announcement got run over inside of two sessions.
Three things this week are worth your time, and two of them cut against what this desk has been arguing.
The first is what the buyback program actually is, because it is not what it is being called, and the difference matters.
The second is a test this desk published eight days ago that settled this week. It did not settle in our favor.
The third is a number nobody put next to another number, and together they explain the whole week.
CONTINUE READING…
The Treasury’s program is not what it is being called, and that is not a semantic quibble. It is the difference between an intervention that can hold a price and one that cannot, which is also the difference between where rates sit today and where they are headed. What follows takes that apart. Forty trillion dollars of debt, and why the doom loop argument still does not follow from it. A raise that cost Walmart shareholders nine percent in a single session. Three officials inside the Fed who wanted a hike. A test the Rebel Capitalist News Desk put in print eight days ago, and how it actually turned out. Then the numbers that settle the next ninety days. Let’s dig in.
Monday and Tuesday: the data ran hot
The week opened with a beat nobody expected.
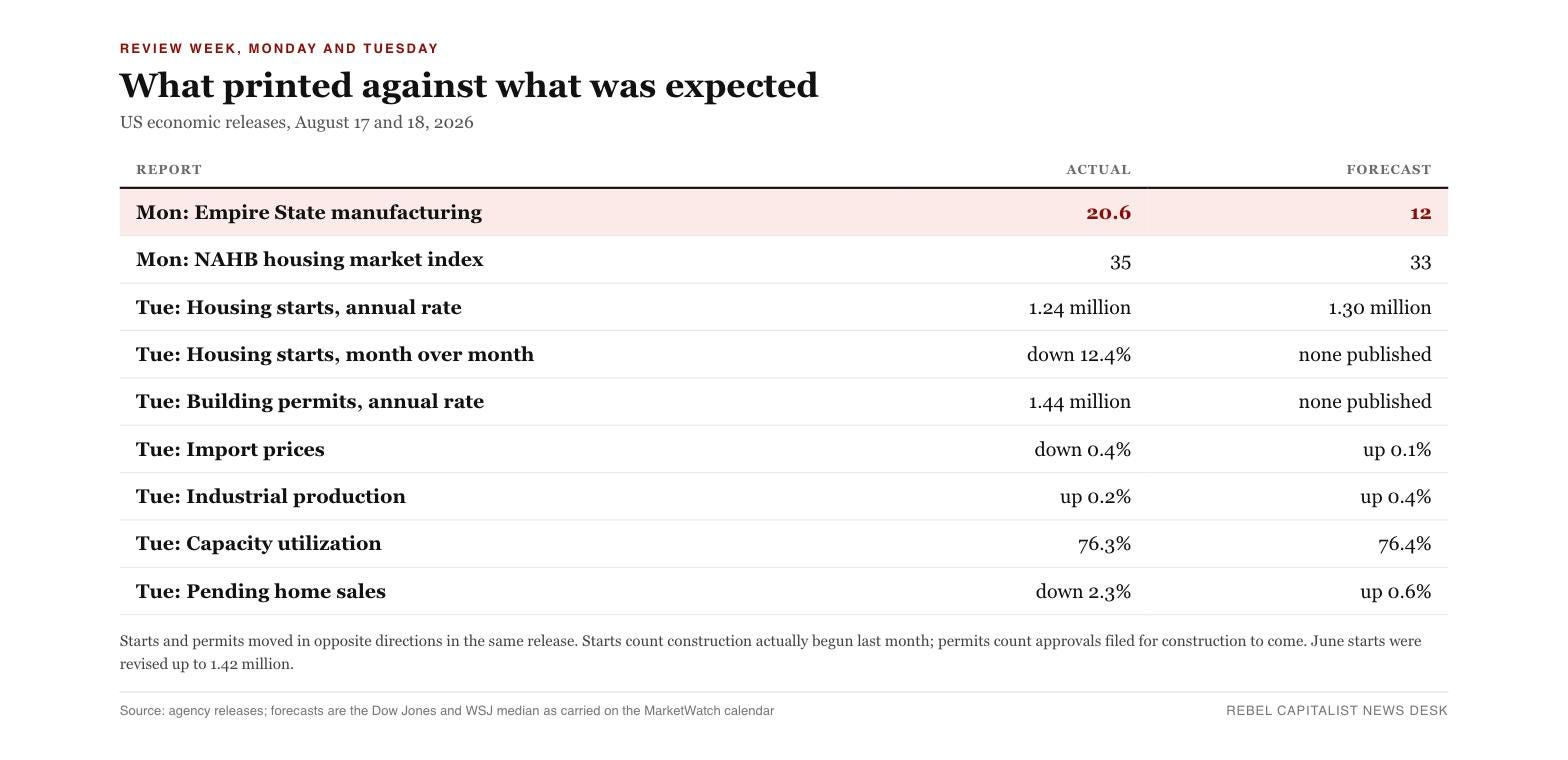
Empire State manufacturing printed 20.6 on Monday, up from 15.6 in July, against a consensus near 11. Consensus is simply the median forecast of the economists surveyed beforehand, and the gap between it and the actual number is what moves markets, not the level. That is the New York Fed’s monthly survey of manufacturers in its district, and it is the first regional factory reading each month, which is why it moves the tape. Nearly double the forecast.
Tuesday split.
Housing starts came in at a 1,239,000 annual rate, down 12.4 percent on the month against a consensus near 1,350,000. That is a large miss, and it is the weak spot in the week. But look at the next line in the same release. Building permits rose 5.0 percent to 1,443,000. Starts are what builders broke ground on last month. Permits are what they intend to build next. Those two moving in opposite directions is not a collapse, it is weather, financing timing, or a revision waiting to happen. The June starts figure was revised up to 1,415,000, which is most of the story.
Industrial production rose 0.2 percent against a consensus of 0.3, with capacity utilization at 76.3 percent, some 3.1 points below its long run average. A small miss.
Pending home sales fell 2.3 percent.
One correction worth making, because it has been circulating. July existing home sales did not come out this week. That report landed on August 11, and it showed a 1.7 percent decline to a 4.06 million annual rate. It is a real number and it is soft. It is just not this week’s news, and the report that did land this week from the same association was pending sales, which is a different series measuring contracts signed rather than deals closed.
Wednesday: the Treasury doubles down, and the name matters
Here is where the week gets interesting, and where the popular version of the story goes wrong.
On Wednesday the Treasury Department announced it was increasing the size of its buyback operations in the long end. Its own words: “increasing, by at least double, the size of liquidity support buyback operations.” The current maximum of $2 billion per operation goes to at least $4 billion. The targets are the ten to twenty year and twenty to thirty year sectors. Operations run September 9 through November 4.
Now the part that has been mangled everywhere.
You have hit the paywall. Here is exactly what is on the other side of it, so you can decide for yourself.
Most of this report is free every week and it will stay that way. You just read the Monday and Tuesday calendar, the Treasury announcement and the terms of the program, all of it sourced to the agencies that published it. What sits below this line is the part that takes the whole week to build: why the name on that program is wrong and why the difference decides where rates go, every spoken number run back against the agency that issued it, the calls this desk put in print eight days ago scored out in the open whether they landed or not, and the specific figures that decide the next ninety days.
Maybe you are thinking this is a weekly recap and you can get one of those anywhere. You can. Recaps are free because they are worth what you pay for them. What you cannot get anywhere is the mechanics underneath the recap. That is the difference between reading on Thursday that the Treasury got run over and knowing on Tuesday that it was going to be.
A subscription also gets you the premium article behind each video and the explainer series. Cancel whenever you want and you keep access through the end of the period you already paid for.
