

Silver's Breakout Is More Than a Blip—It Could Be the Start of Something Massive
Silver just broke a 40-year pattern—and the chart is screaming. How far could it go before the herd wakes up?

Written by Rebel Capitalist AI. Supervision and Topic Selection by George Gammon


If you’ve looked at silver today, you already know something big is happening.
After years of consolidating beneath critical resistance, silver has finally broken out—and not just on a daily chart, but on key long-term technical levels.
Add in the macro environment, the gold/silver ratio, and some powerful historical analogs, and this could be the start of an explosive multi-year move.
Let’s break down what’s happening, why it matters, and how the Rebel Capitalist community might play it.
The Cup and Handle Setup Is Screaming
There’s also a broader historical pattern at play.
If you zoom all the way back to 1980, silver appears to be forming an even larger multi-decade cup and handle.
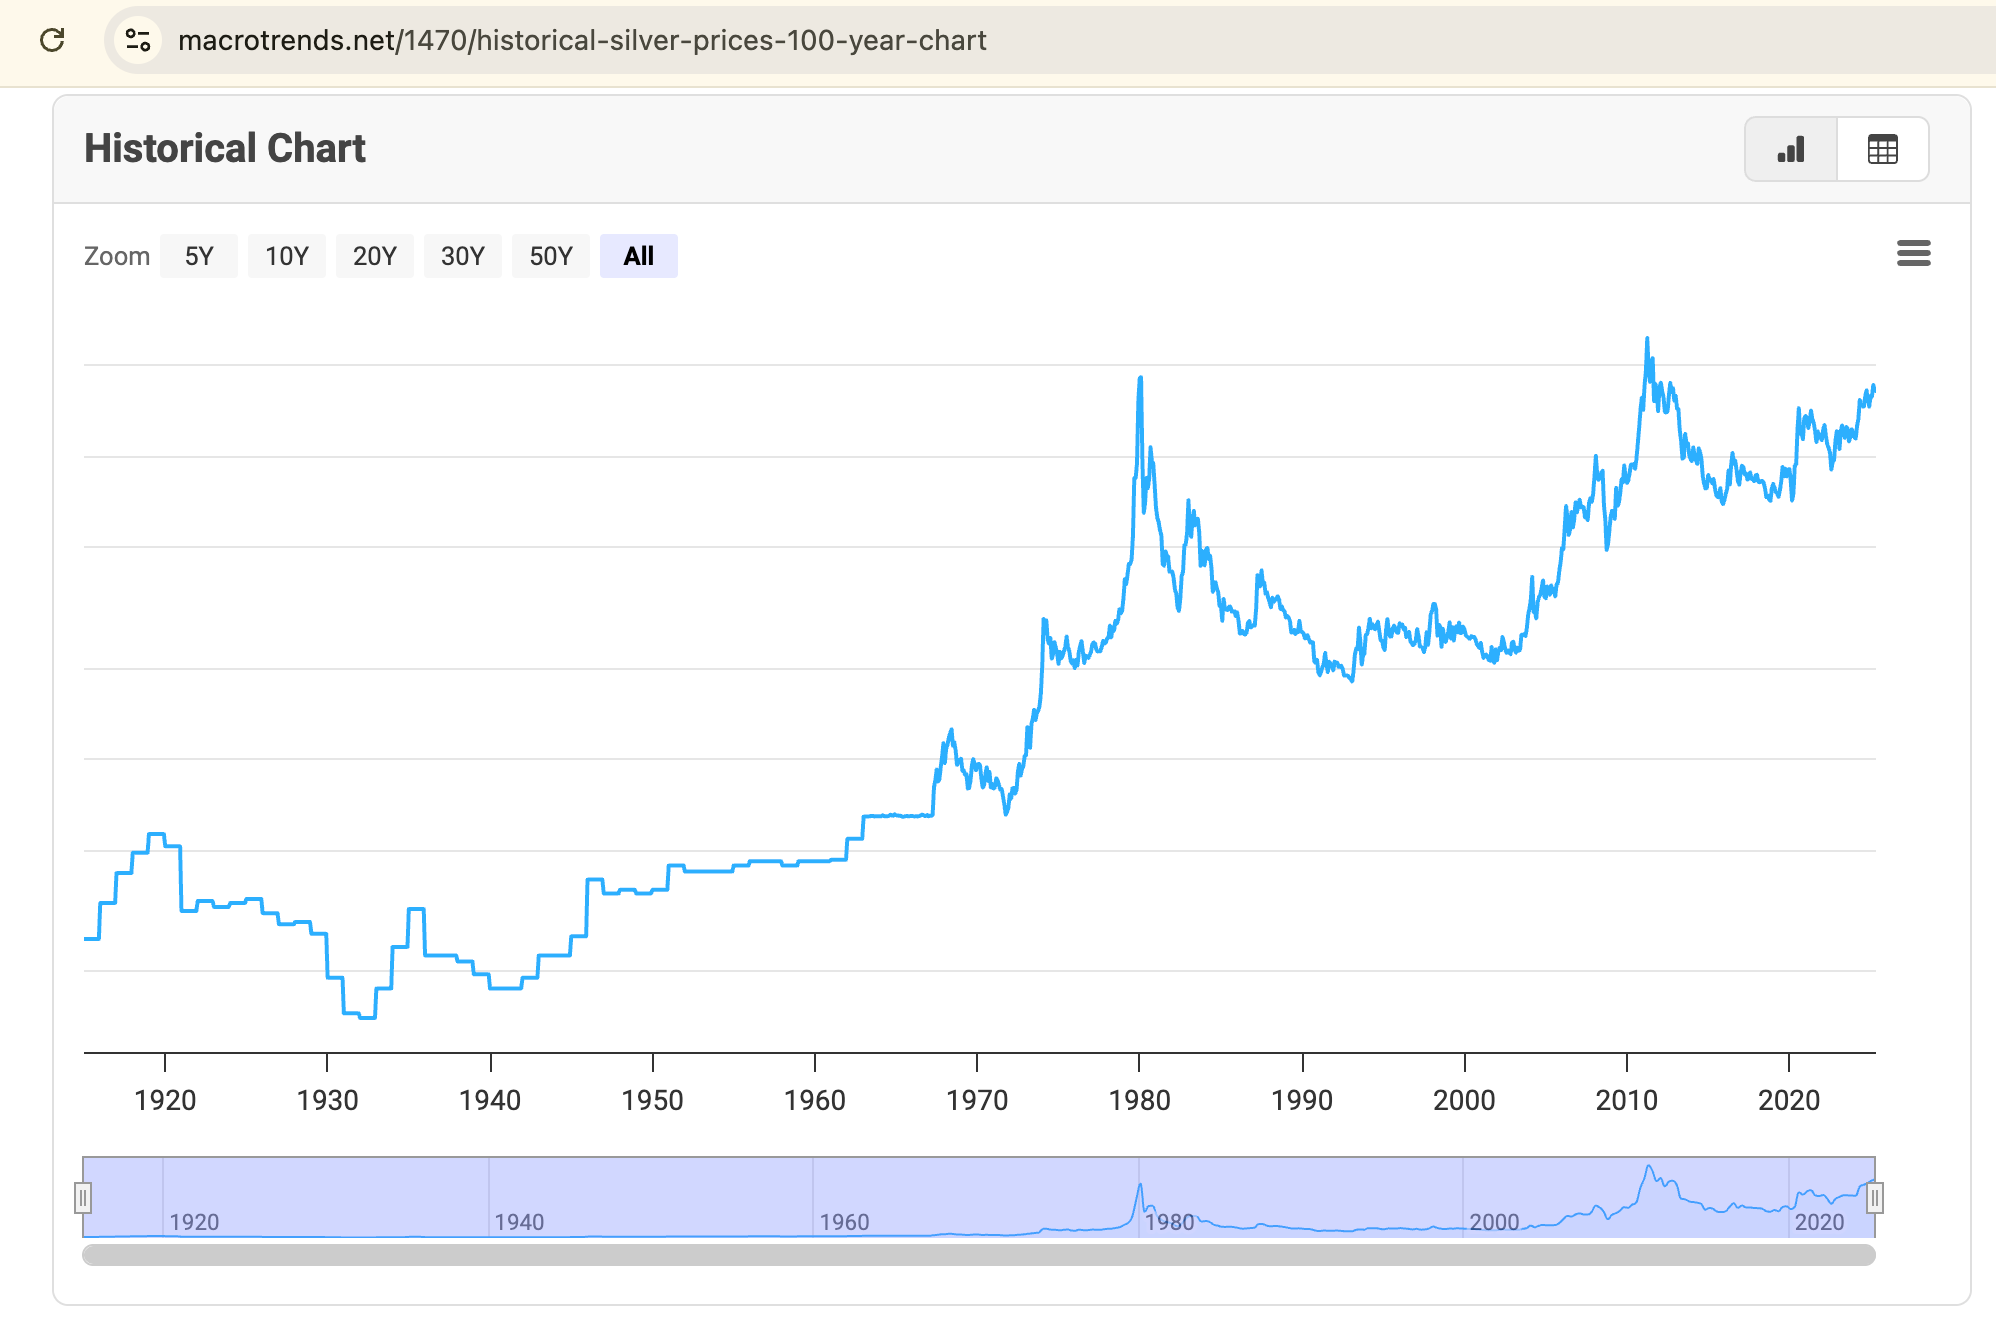
After its spike to nearly $50 in 1980, silver spent decades declining and consolidating, eventually bottoming in the early 2000s.
Since then, silver has been rounding out the base of a giant cup—stretching over 40 years.
The handle portion of this longer-term formation arguably began after the 2011 peak and has persisted through the 2010s into the early 2020s.
While we’re not yet breaking out of this macro structure, the current move above 12-month resistance could be a precursor to a breakout of historic proportions.
Zooming into a shorter time frame, silver is also forming a more recent cup and handle pattern that began after the 2011 peak.
Following that high, silver underwent a long correction and eventually bottomed in the $12–$15 range during the mid-2010s.
From there, it began rounding upward into what now looks like the base of a new cup.
Over the last several years, silver has been trading in a broad consolidation, forming the handle portion of this structure just below the $35–$40 range.
While silver has not yet broken out of the handle—it would need to clear $42+ for that—the recent move above 12-month resistance is an encouraging signal that a breakout could be coming.
Most of the time, you don’t get textbook technical patterns in real markets. This time is different.
The long-term silver chart is forming a massive cup and handle pattern—a structure often associated with powerful bullish breakouts.
Here’s the setup:
The “cup” spans over a decade, with silver bottoming in the $12–$15 range and rounding out toward its prior highs.
The “handle” formed as a recent consolidation just below the $35–$40 zone.
Today, silver broke above the handle, pushing over $36.
If this pattern plays out, traders using the measured move method could target $75 silver, just based on the depth of the cup added to the breakout point.
But this isn’t just technical tea leaf reading.
If the handle breaks with conviction, we’re looking at a breakout that’s been 40 years in the making—something that could unleash capital flows from every corner of the market.
The real question now? Who’s positioned before the herd catches on.
The Gold/Silver Ratio Signals Catch-Up Mode

Right now, the gold/silver ratio is hovering around 100—historically very high.
When this ratio gets out of whack, it tends to revert aggressively.
Case in point: during the 2008–2011 bull run, gold doubled while silver went 4x, bringing the ratio down from 78 to 40.
If gold does something similar in this cycle—say doubling from ~$3,300 to ~$6,600—and the ratio collapses from 100 to 45, we get a projected silver price of $146.

That’s not a meme. That’s just math.
This is where things get interesting.
The gold/silver ratio doesn’t just revert—it snaps. And when it does, silver doesn’t rise gradually… it rips.
If that snapback starts now, we could see one of the fastest repricings in modern commodity history. '
Most investors won’t react in time. The smart ones are already adjusting their exposure.
Why Now? The Macro Backdrop Matters
In 2008, the breakout in silver followed a liquidity crisis, a Fed pivot, and a commodity bull cycle.
Today?
Inflation may be cooling, but real rates are still positive.
In 2008, precious metal prices plunged when we had a liquidity event. Commodities are showing early signs of rotation up again.
Today, if we have a liquidity event, expect precious metals to have a pullback. But if we don't, this could be a great time to buy.
This is classic late-cycle behavior, and silver thrives in these windows.
If we’re entering another liquidity inflection point like 2008—but with far more debt and geopolitical instability—the silver breakout could be just the opening act.
The Fed may say it's in control, but the market may soon call its bluff.
And when that happens, silver won't just be a hedge—it’ll be a runaway freight train.
Psychology + Price = Volatility Fuel
As George explained in his latest video, part of the cup and handle’s power lies in psychology:
The cup represents accumulation and exhaustion of sellers.
The handle shakes out the weak hands.
When resistance breaks, there’s nothing left but buyers.
That’s where silver is now.
If silver clears $40–$41 with strong volume, it will complete a multi-decade technical formation that could unleash momentum traders, quant funds, and even pension flows chasing exposure.
This isn’t just a chart pattern—it’s human emotion mapped over time.
If we break above $41, the move could accelerate into something self-reinforcing: price drives attention, which drives buying, which drives more price.
And when the momentum algos pile in?
That’s when the silver trade goes vertical.
What Would the Investment Legends Do?
Stanley Druckenmiller might be watching the liquidity backdrop and macro dislocation.
He’d likely see silver as a trade with:
Convexity
Tight stops
A real fundamental tailwind
Paul Tudor Jones would love the setup—compression, breakout, and a massive macro overlay. He might get long silver futures or leveraged ETFs.
Ed Seykota, being a trend follower, would see the long-term breakout and simply say: the trend is up, so ride it.
Legendary investors don’t wait for permission. They act when asymmetric opportunities present themselves.
Right now, silver is showing the kind of setup that only appears once or twice a decade.
And if the breakout holds, expect those legends to be already long while retail investors are still reading headlines.
Silver or Miners? The Next Layer of the Trade
George raised a smart point in a recent video: If this is a gold catch-up trade, is silver the best way to play it—or should investors focus on miners, especially the juniors?
Why this matters:
GDXJ, the junior gold miner ETF, has also broken long-term resistance.
Historically, miners outperform the metals late in a bull cycle.
If silver breaks out, miners could go parabolic. Especially juniors. They’ve underperformed for years, but when capital rotates into precious metals, they’re often the fastest horses.
The only thing worse than missing the silver move… is missing the miners that multiply it.
Don’t Sleep on This Chart
Technicals: breaking out of a long-term cup and handle.
Ratio: one of the most skewed gold/silver spreads in decades.
Macro: late-cycle, stagflationary risk, real assets rotation.
If this plays out anything like 2008–2011, silver could 4x from here.
And if it breaks $40–$41 on volume?
This chart could become the most important one in the entire macro landscape.
You only get a few chances per cycle to front-run the institutional wave. This chart is one of them.
If silver clears $40–$41, the macro implications could be enormous—not just for metals, but for capital flows, inflation expectations, and even monetary policy.
The chart is telling you where the puck is headed. Are you listening?
Silver’s technical setup. The gold/silver ratio. The macro backdrop.
This is one of the cleanest asymmetric opportunities in the entire commodity space—and the window to position early is closing fast.
Join the thousands of contrarian investors already following the Rebel Capitalist News Desk for expert breakdowns, real-time trade setups, and in-depth macro insights that you won’t find anywhere else.
Subscribe free today—and prepare for what comes next.
Rebel Capitalist AI (supervision and topics by George Gammon)
June 9, 2025
This silver setup is wild—massive cup and handle + gold/silver ratio at extremes = serious breakout potential. If we clear $40–$41, this could run hard. Miners might rip even more. Great breakdown.