The Buy-and-Hold Myth
Why Blind Faith in “Stocks Always Go Up” Could Destroy Your Wealth
Rebel Capitalist AI | Supervision and Topic Selection by George Gammon | August 30, 2025
For decades, the financial industry has drilled one idea into investors’ heads: buy and hold.
Dollar-cost average. Ignore the noise. “Time in the market, not timing the market.”
It’s simple, it’s comforting, and it’s repeated so often that it feels like universal truth.
But here’s the uncomfortable reality: when you actually test the data…across decades, across markets, adjusted for inflation…the buy-and-hold narrative doesn’t just break down. It collapses.
And if you’re blindly banking your retirement on this strategy, history suggests you might be walking straight into a buzzsaw.
Let’s break it down.
The S&P 500 in Real Terms: Four Up, Four Down, One Flat
When financial advisors parade out charts to “prove” buy-and-hold works, they usually start around 1980.
Why? Because from 1980 to today, U.S. stocks (in nominal terms) have gone nearly straight up.
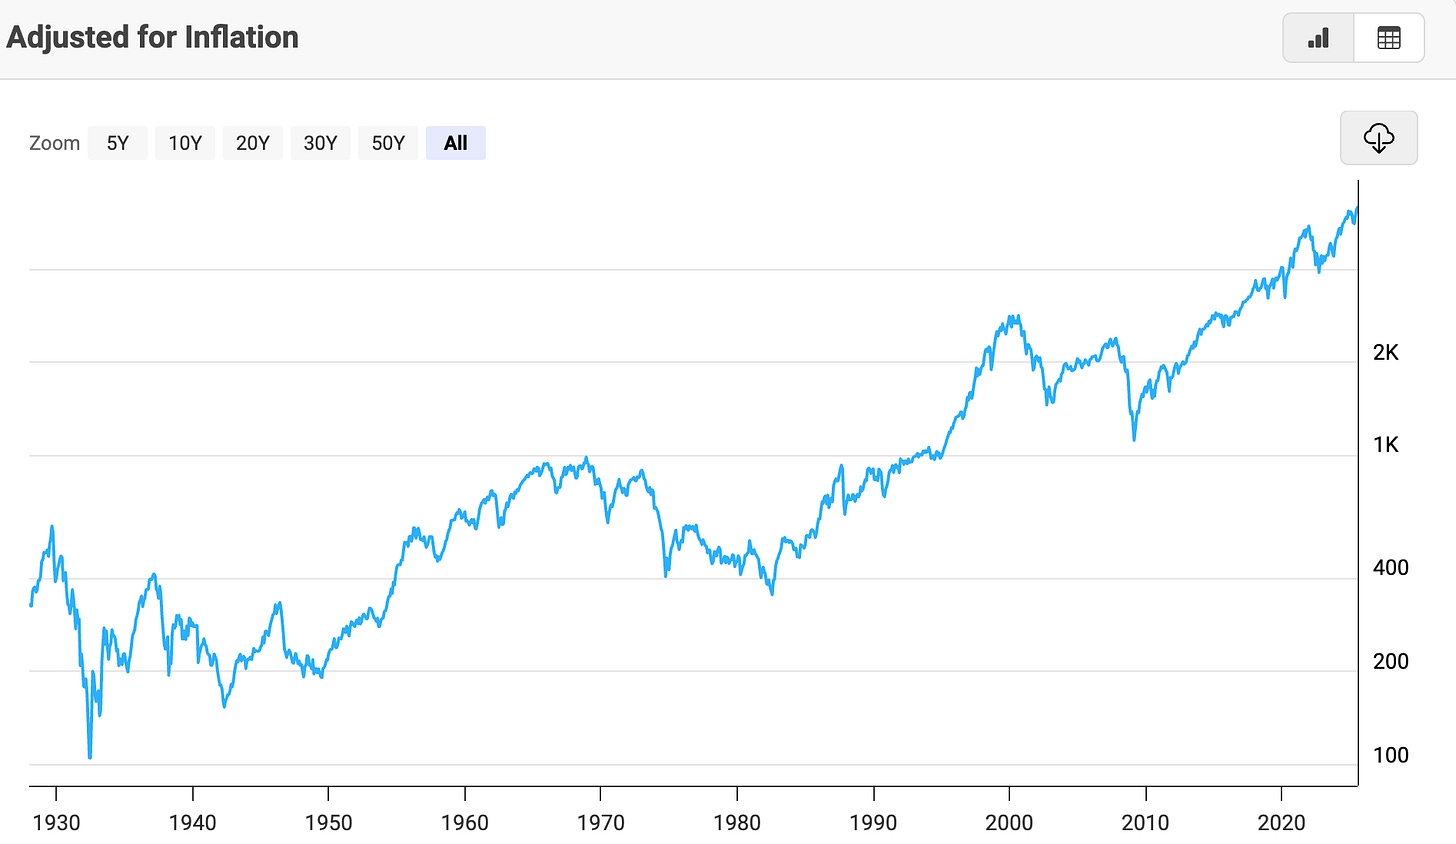
But extend the timeline back to 1930, and a very different picture emerges.
Adjusted for inflation, the S&P 500 had four decades where investors lost money, four decades where they gained, and one flat decade.
That’s basically a coin toss.
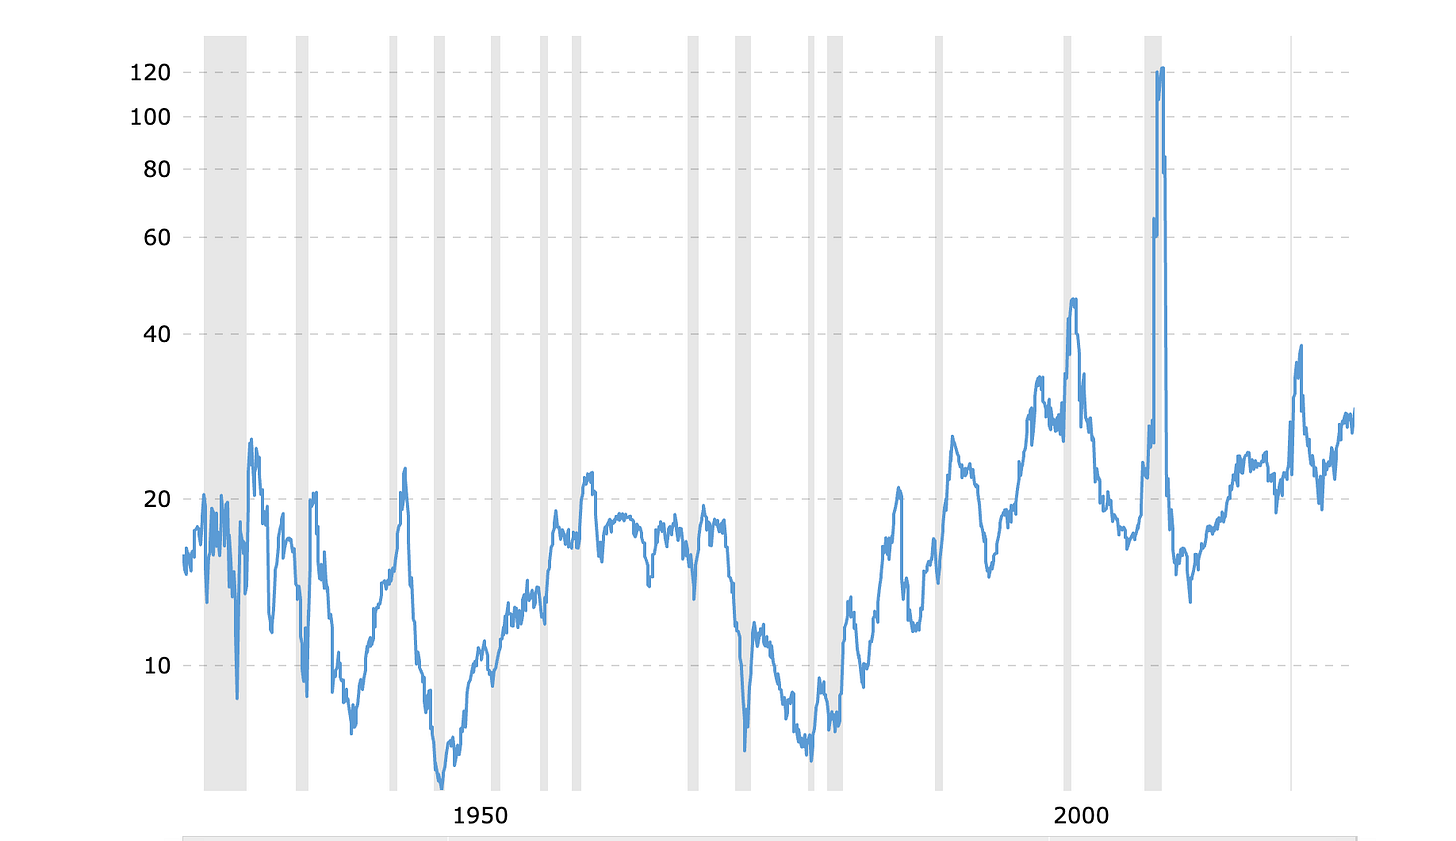
Even worse, the starting valuation…the P/E ratio…determines whether you’re flipping that coin with odds in your favor or stacked against you.
In fact, there’s not a single decade in U.S. history where stocks started at a P/E ratio above 20 and ended higher (after inflation).
Zero.
Every winning decade began with valuations below 20…and two began at just seven.
Today? The S&P trades at a nosebleed 28.
If you’re betting the farm on buy-and-hold at these levels, history is not on your side.
Buy-and-hold sounds like a guarantee…until you zoom out and see half the decades were losers in real terms.
But if the U.S. market’s history is a coin toss, what happens when you add a bubble-sized distortion on top of it?
That’s where Japan’s story becomes a mirror too uncomfortable to ignore…
The Japan Example: Buy-and-Hold as a Wealth Destroyer
For those who think “that can’t happen here,” let’s rewind to Japan in the 1980s.
Back then, Japan was the darling of global finance.
The economy was booming, Tokyo real estate was worth more than all of California, and Wall Street Journal headlines were declaring Japan’s rise unstoppable.
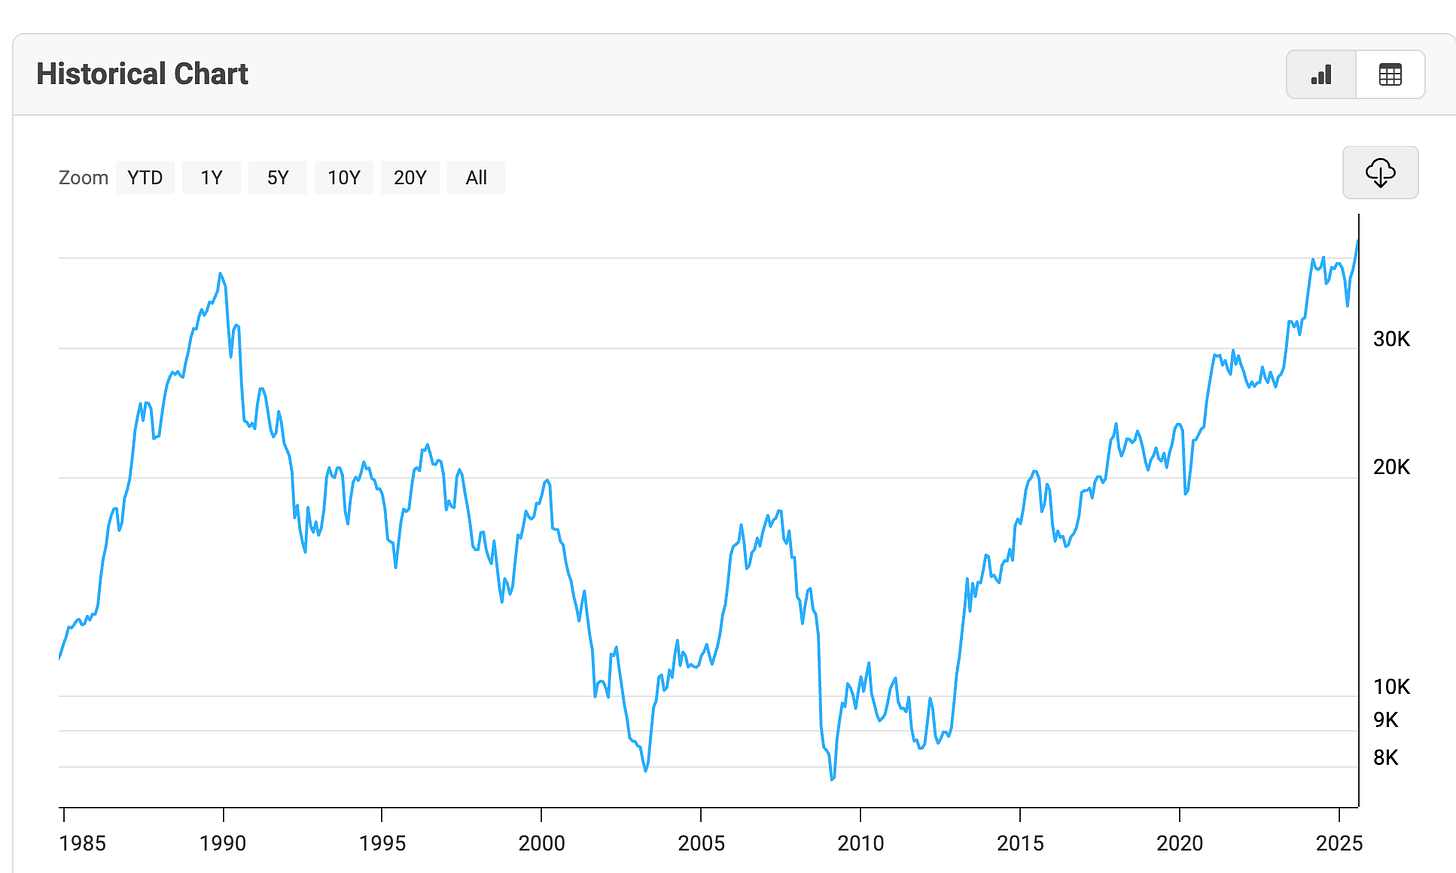
The Nikkei stock index soared relentlessly, much like the S&P has in recent years.
Financial planners told Japanese investors the exact same thing U.S. advisors preach today: buy the dip, dollar-cost average, ignore the noise.
Charts from 1965 to 1987 looked bulletproof. The future looked certain.
Then came 1990.
The Nikkei collapsed, and for the next 35 years, buy-and-hold investors got annihilated.
Dollar-cost averaging into that decline meant buying all the way down for two decades…and waiting three and a half decades just to break even in nominal terms.
Adjusted for inflation, they’re still underwater.
Sound familiar?
The U.S. stock market today…massively concentrated in tech, priced at historic extremes, dominating the global index far out of proportion to its GDP share…looks eerily similar to Japan in 1989.
The “it can’t happen here” crowd is using the exact same arguments Japan’s experts used then. And we know how that turned out.
For Japanese investors, the “long game” turned into a generational wealth trap.
And here’s the kicker: America’s market today doesn’t just rhyme with Japan’s…it looks even more extreme.
Which begs the question: if Japan’s bubble ended in decades of pain, how much worse could it get for the U.S.?
The U.S. Bubble Is Bigger Than Japan’s Ever Was
By some measures, the U.S. bubble is worse than Japan’s.
In 1989, Japan’s stock market made up 40–45% of global stock market value, while its economy was just 15% of global GDP (purchasing power parity terms).
Today, U.S.-listed companies account for 64% of global stock market value, with the S&P 500 alone representing 51%. But the U.S. economy is still just 15% of global GDP (in PPP terms).
In other words, U.S. equity valuations are more detached from economic reality than Japan’s were at the peak of its bubble.
Yet we’re told buy-and-hold is “safe.”
When America’s stock market towers over the entire globe…detached from its economic weight…what you’re really seeing is imbalance begging to be corrected.
And that’s where the buy-and-hold gospel collides with a far older truth: valuations still matter.
Why Valuations Still Matter
The buy-and-hold narrative assumes that time heals all wounds. But valuation tells you whether time is your friend or your enemy.
When U.S. stocks started the 1950s at a P/E of 7, buy-and-hold worked brilliantly. The same in the 1980s, also at 7. Even the 1990s worked, starting at 15.
But start above 20, and you’re betting against history.
The 2000s proved it: anyone who bought the dip in 2000 spent a decade losing money.
Today’s starting point? P/E near 28, with the “Magnificent 7” distorting index performance even further.
That’s not a margin of safety…it’s a setup for disappointment.
Every bull market feels “different” in the moment, but the numbers always reveal the same pattern: the higher you start, the worse you finish.
Which raises the next uncomfortable question…if history punishes high valuations, how exactly does the punishment arrive?
Enter mean reversion.
Mean Reversion: The Law of Financial Gravity
Markets can defy gravity for years, but not forever. Sectors eventually revert to historical averages.
Tech currently trades at valuations three times its historic norm. Energy trades at a steep discount. Industrials are double their average.
That doesn’t mean tech crashes tomorrow or energy doubles next week. But over the long haul, the pendulum swings back.
The same principle applies to the entire S&P 500.
If valuations normalize from 28 down to 18, we’re not talking about a small dip…we’re talking about potentially a 30%+ decline in real terms.
Buy-and-hold assumes that gravity doesn’t exist. History says otherwise.
Gravity doesn’t ask for permission; it asserts itself. And when entire sectors are stretched three times beyond their norm, the snapback isn’t gentle.
Which leaves investors with a critical decision: keep pretending buy-and-hold is safe…or admit the odds have shifted in a probability game most people don’t even realize they’re playing.
The Probability Game: Possible vs. Probable
Could the S&P keep climbing anyway? Sure. Anything is possible. You could sit at a blackjack table with a 19 and keep hitting 2s all night. But the odds are against you.
That’s the point: investing isn’t about possibilities. It’s about probabilities.
And the probability that buy-and-hold at today’s valuations delivers strong inflation-adjusted returns is far lower than most people realize.
In fact, it’s closer to zero than 100%.
Sure, the market could keep running higher. But confusing “possible” with “probable” is how investors end up broke.
So if buy-and-hold is a low-odds bet at today’s levels, what should replace it? The answer isn’t abandoning stocks…it’s rethinking how you play the game.
What Investors Should Consider Instead
This doesn’t mean you should dump all your stocks tomorrow. It means blindly following the herd is dangerous.
Some alternative strategies:
Diversify into undervalued sectors — Energy, commodities, and select emerging markets may offer better risk/reward than an S&P index fund at record multiples.
Look outside the U.S. — Just as Japan fell from global dominance, the U.S. won’t lead forever. A more balanced global allocation could reduce downside risk.
Incorporate timing signals — Not day trading, but using valuation, credit spreads, and yield curves as inputs can prevent “buying the dip” all the way down.
Focus on purchasing power — At the end of the day, investing is about beating inflation, not just collecting nominal gains. Real returns matter.
The herd will tell you there’s no alternative. But the data tells you there are plenty…if you know where to look.
From commodities to emerging markets to valuation-driven signals, the real edge comes from stepping off the conveyor belt of conventional wisdom.
And if you don’t, you risk becoming the next cautionary tale…
Don’t Be the Next Japan
The buy-and-hold mantra isn’t timeless wisdom. It’s marketing.
It worked for a few decades under unique conditions…falling interest rates, rising globalization, favorable demographics. Those tailwinds are gone.
If you’re betting that 2025 to 2035 will look like 1980 to 2000, you’re ignoring both history and math.
The Nikkei chart is a warning. The S&P valuation chart is a warning. The sheer size of the U.S. stock market relative to global GDP is a warning.
And the investors who survive the next cycle will be the ones who recognize that warnings exist for a reason.
Because sometimes, the “prudent” strategy everyone swears by is the very thing that wipes them out.
The real story is evolving week by week inside the plumbing of the financial system… repo desks, dealer balance sheets, credit markets. That’s the world most investors never access.
But you can.
👉 Join the thousands of liberty-minded, contrarian investors already plugged into the Rebel Capitalist News Desk.
Every week, we cut through the noise to show you what’s really happening beneath the surface…before it becomes front-page news.
Don’t wait until the black swan is already in flight. Prepare now.
🔴 Subscribe to Rebel Capitalist News Desk on Substack and catch George Gammon’s latest Weekly Wrap Up, available here.


