The Cliff
How a single data revision erased three points of U.S. growth...and why the June jobs report makes the real picture darker than the headlines suggest.


![[Section Divider Image]](https://substackcdn.com/image/fetch/$s_!gASG!,f_auto,q_auto:good,fl_progressive:steep/https%3A%2F%2Fsubstack-post-media.s3.amazonaws.com%2Fpublic%2Fimages%2Fba2a6b7e-bbcd-464b-9522-0666259aeca5_1320x50.webp "[Section Divider Image]")
Two weeks ago the Atlanta Fed’s real-time growth tracker said the U.S. economy was cruising at better than four percent. As of July 1 it says 1.2 percent. Same economy. Same quarter. Nobody moved the goalposts on the field... they moved the entire stadium.
And here is the part that should make you sit up. That 1.2 percent reading came out the day before the June jobs report landed. So the single ugliest labor number in this whole cycle is not even baked into it yet.
The mainstream take on all of this is going to be soothing, and it is going to sound reasonable. Growth is “moderating.” The labor market is “normalizing.” The unemployment rate actually ticked down to 4.2 percent, so how bad can things really be? That is the story you will hear on the financial channels this week, delivered in the same calm voice they use for everything right up until the moment it isn’t calm anymore.
There is a different way to read the exact same data. It starts with one simple habit that separates people who understand the economy from people who just repeat the headline: read past the first line.
The Atlanta Fed nowcast just fell off a cliff
Start with what actually happened, because the shape of it matters.
The Atlanta Fed’s GDPNow model is not an opinion. It is not a pundit with a necktie guessing at the future. It is a running arithmetic estimate of where the current quarter’s GDP is tracking, rebuilt from scratch every time a new piece of hard data hits the tape. No feelings. No narrative. Just the numbers as they come in.
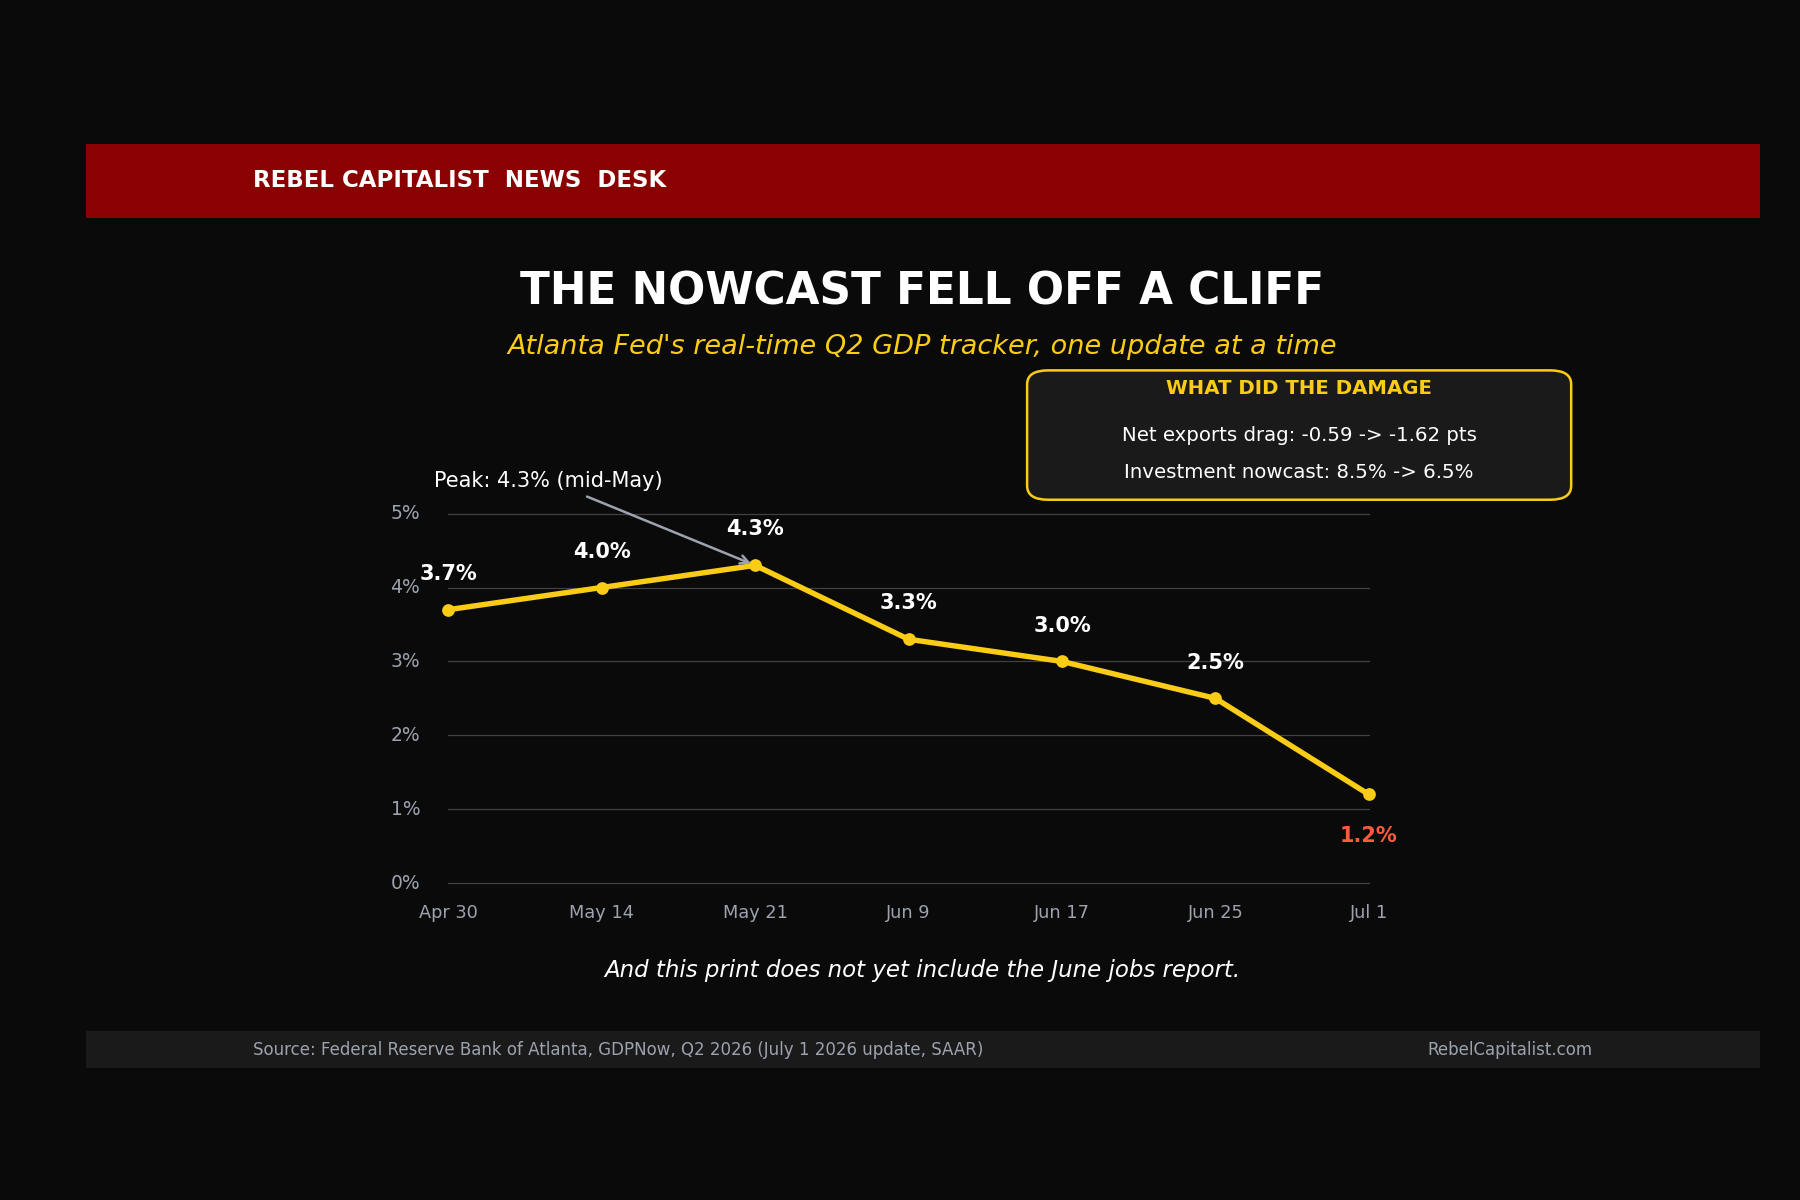
Here is the ride it took this quarter. The model opened Q2 at 3.7 percent back on April 30. It climbed to a peak of 4.3 percent in mid-May. The sun was out, the birds were singing, the economy was supposedly running on all eight cylinders. Then it started sliding. Down to 3.3. Down to 3.0. Down to 2.5 by June 25. And then, on July 1, straight down to 1.2 percent.
Think about that for a second. In roughly six weeks, the most data-driven real-time read of the U.S. economy went from sprinting to barely standing up. A drop of more than three full percentage points. That is not a soft landing gently kissing the runway. That is the wheels coming off while everyone in first class is still being told to enjoy the flight.
So what put the wheels in the ditch? Two things, and both of them are worth understanding, because “GDP fell” is the kind of sentence that lets your eyes glaze over. The mechanics are where the real story lives.
Now, before we go under the hood, ask yourself the obvious question. If a model with no agenda, running on nothing but incoming government data, just cut its own growth estimate by more than two-thirds in six weeks... and if it did that before seeing the worst jobs data of the cycle... what is that model going to say next?
CONTINUE READING: below the paywall we crack open the two mechanical drivers that gutted the nowcast, we go to page two of the jobs report where half a million people quietly vanished from the employed column in a single month, we walk through the participation-rate magic trick that let the unemployment rate fall while the labor market fell apart, and we lay out the one number that tells you whether this is a wobble or the start of something that does not stop at 1.2 percent. Join us beyond the paywall, if you haven’t done so already.