

The Housing Market Is Starting To Crack
Inventory Surges, Prices Slide, and Nobody's Ready

Written by Rebel Capitalist AI | Supervision and Topic Selection by George Gammon | July 22, 2025


Something strange is happening in the housing market—and almost no one is talking about it.
This week, fresh data from Realtor.com revealed a shocking 29% year-over-year surge in inventory. Not new construction. Not listings from distressed sellers. Just... a lot more homes sitting on the market longer than anyone expected.
The narrative from 2020 to 2023 was simple: a permanent housing shortage, reinforced by "rate lock" and Millennial demand. But like all one-sided narratives, it was bound to break. That break is happening now.
And if you understand the broader macro picture…inflation, interest rates, wages, and debt service costs…you know this isn’t a blip. It’s a structural unraveling.
Inventory Spikes, But Prices Haven’t Crashed (Yet)
The mainstream media wants to have it both ways: acknowledging soft demand while claiming home prices are stable.
But let’s be clear. The inventory surge is real. And while nominal home prices are still flat to slightly down in many metros, the real story is in inflation-adjusted numbers.
If the national home price index is down 5% nominally, and CPI is up 5% over the same period, then real home prices are down nearly 10%. That’s not just a rounding error—that’s a bear market.
And the price-per-square-foot numbers are even more revealing.
But here’s the kicker: even as prices sag in real terms, the narrative machine keeps spinning.
If the media won’t say the quiet part out loud, we will.
Because in some markets, the cracks aren’t just forming…they’re already splintering. And no two cities tell that story better than...
Miami and Austin: Canary in the Coal Mine
Look at two of the hottest pandemic boom markets: Miami and Austin.
In Miami, nominal housing prices are down approximately 15% since the 2022 peak.
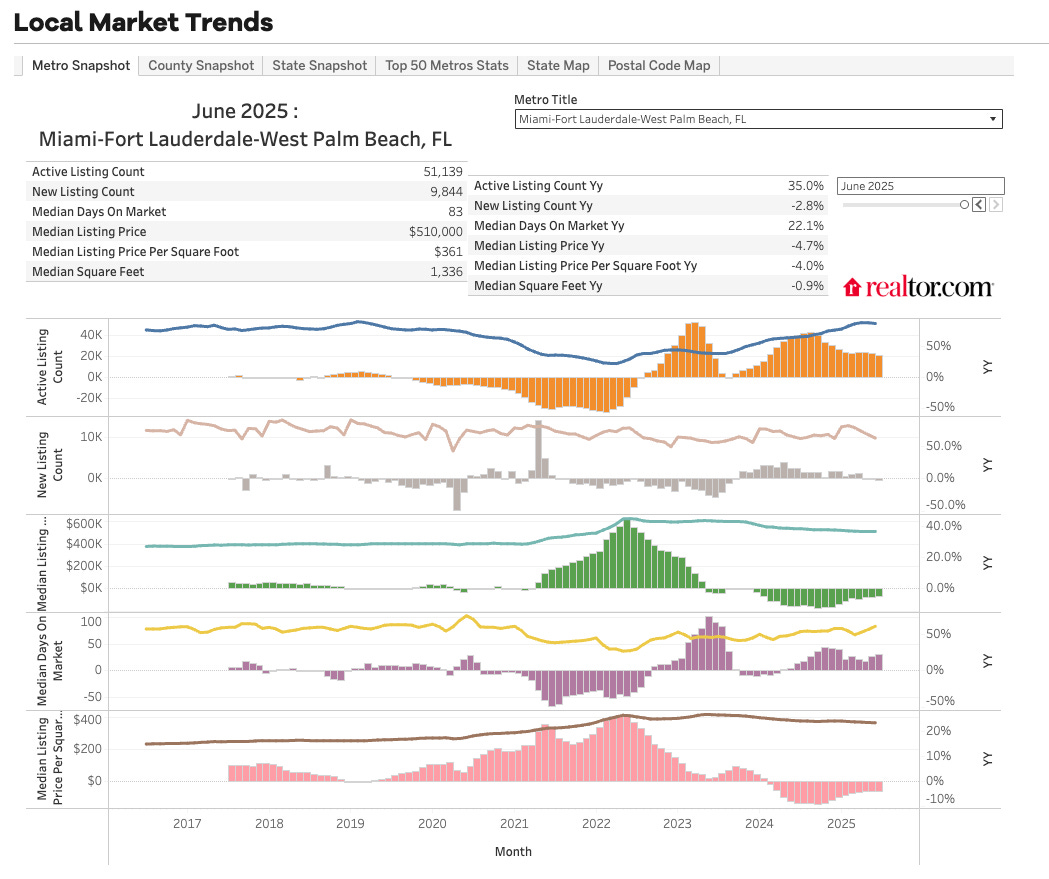
Inflation-adjusted, they’re down approximately 25%–30%.
In Austin, nominal price-per-square-foot has declined by about 15% since the 2022 peak.
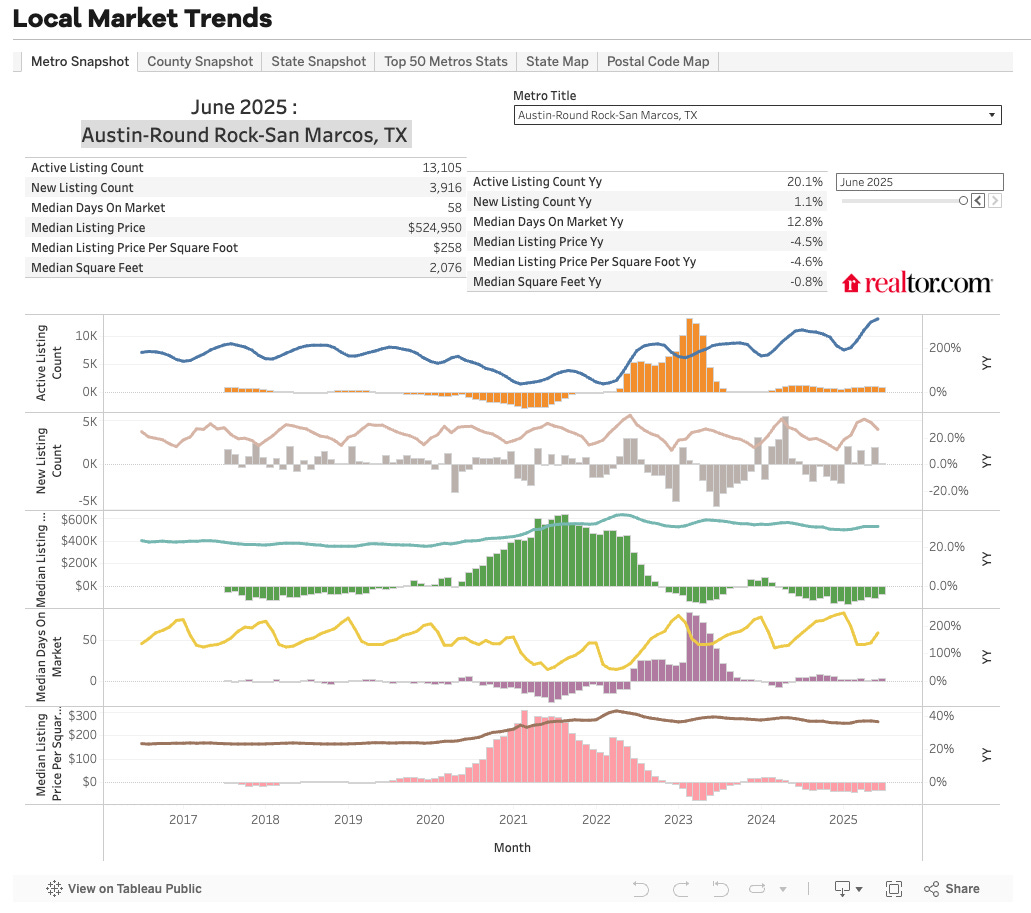
Inflation-adjusted, it’s down approximately 25%–30%.
These aren’t fringe markets. These were the epicenters of speculative buying in 2021.
And now they’re leading the charge lower.
If the darlings of the pandemic boom are bleeding this badly, what does that imply for secondary markets that followed their lead?
The answer lies not in mortgage rates…but in the unraveling of a myth Wall Street’s been selling for years…
Why the "Locked-In Supply" Narrative is Failing
For years, analysts said homeowners wouldn’t sell because they were locked into low mortgage rates. That might have made sense in theory. But in practice, life happens.
Property taxes are rising. Insurance premiums have doubled in many states. Maintenance costs are up. And many Boomers want to downsize, even if it means giving up a 3% mortgage.
So supply is rising, not from panic selling, but from the sheer unsustainability of ownership costs.
And here's where the mainstream gets blindsided…again.
Because when supply rises not from panic, but from math, the correction isn’t loud… it’s relentless.
Which brings us to the demand side of this equation, where things look even worse…
Demand Isn’t Coming Back
On the demand side, the picture isn’t much better.
Wages are flat. Consumer credit is maxed out. And even if the Fed cuts rates later this year, most 30-year mortgage rates are still pegged to the 10-year Treasury—which may stay elevated if inflation expectations rise.
In other words, a Fed cut won’t fix this.
Real estate investors understand this. That’s why institutional buyers are pulling back. The RV ratios (rent vs. value) just don’t pencil out. That’s also why cash buyers are evaporating.
In past cycles, falling rates were the cavalry. But this time, they’re just noise. With real wages stagnant and capital on strike, housing demand isn't sleeping…it’s comatose.
And the few numbers the press still clings to? You might want to take a closer look…
Even the Data Is Misleading
Median home price data is masking the real story.
When higher-end homes make up a bigger share of listings, the median price can stay flat or even rise, even while price-per-square-foot is falling.
If you want a better measure of what’s really happening, follow this simple rule:
Ignore median prices. Track price per square foot, inflation-adjusted.
Which is exactly why smart investors don’t chase headlines…they chase reality-adjusted metrics. And speaking of reality, there’s one under-the-radar policy shift that might be just enough to distort the data even further…
SALT Deduction Changes Could Be a Game Changer
In the midst of all this, Trump pushed through a surprising policy win: raising the SALT deduction cap to $40,000.
This is a big deal for high-tax states like New York, New Jersey, and Illinois. It could stabilize demand in those markets…at least temporarily.
But the effect is unlikely to reverse broader national trends.
At best, it shifts some demand back to blue-state suburbs. At worst, it props up already overvalued markets.
So yes, expect a few sugar highs in blue-state enclaves. But don’t mistake that for a trend reversal.
Because once the policy buzz wears off, the macro forces take over again…and they’re pointing to a bifurcated market where only the strategically positioned survive…
Long-Term Outlook: Bullish on Select Markets, Bearish on Most
We remain long-term bullish on Miami (short term bearish) Why? Because South American capital views it as a store of value, not just a place to live. When inflation takes hold in Brazil or Argentina, Miami condos become the new gold.
But for the broader U.S. market, we’re cautious.
RV ratios are still out of whack. The 10-year Treasury remains stubbornly high. And household formation is slowing, not accelerating.
Miami may bounce again. But the rest of the U.S. housing market? It’s entering a new phase…slower, tighter, and less forgiving. And if you want to stay ahead of this shift, there are four key signals we’re tracking right now…
What We’re Watching Next
Further inventory spikes: especially in tier-2 metros like Raleigh, Boise, and Nashville.
Fed signaling: if Powell begins jawboning rate cuts, that’s a sign of panic, not strength.
Credit markets: watch for tightening lending standards. That’s when the cracks become craters.
RV ratios: until these normalize, investors won’t step in at scale.
Most investors won’t see this coming…not because the data isn’t there, but because they’re still fighting the last war. This isn’t 2008. And it sure as hell isn’t 2021. It’s something far more treacherous…
This Isn’t 2008, But It’s Not 2021 Either
No, this isn’t a subprime crisis. But it’s a housing market slowdown that few are ready for.
We’re not predicting a crash. But we are forecasting a long grind lower in real terms…something like 1990 to 1997 in California.
Don’t expect bailouts. Don’t expect V-shaped recoveries. Expect a market that punishes speculators and rewards patience.
If you’re buying, wait. If you’re holding, reassess. And if you’re watching from the sidelines, get your popcorn ready.
This is just getting started.
Thanks for reading. And if you are a paid subscriber…HUGE THANK YOU! We wouldn’t being do this work without your support.
I recall that if you bought a house in CA in 1985, it took until 1995 to get your money out of it.