![[Section Divider Image]](https://substackcdn.com/image/fetch/$s_!uL0U!,f_auto,q_auto:good,fl_progressive:steep/https%3A%2F%2Fsubstack-post-media.s3.amazonaws.com%2Fpublic%2Fimages%2Feb61a550-c2b5-4f91-85bf-66bd4c64d076_1320x50.webp "[Section Divider Image]")
Here is a number that is supposed to be good news.
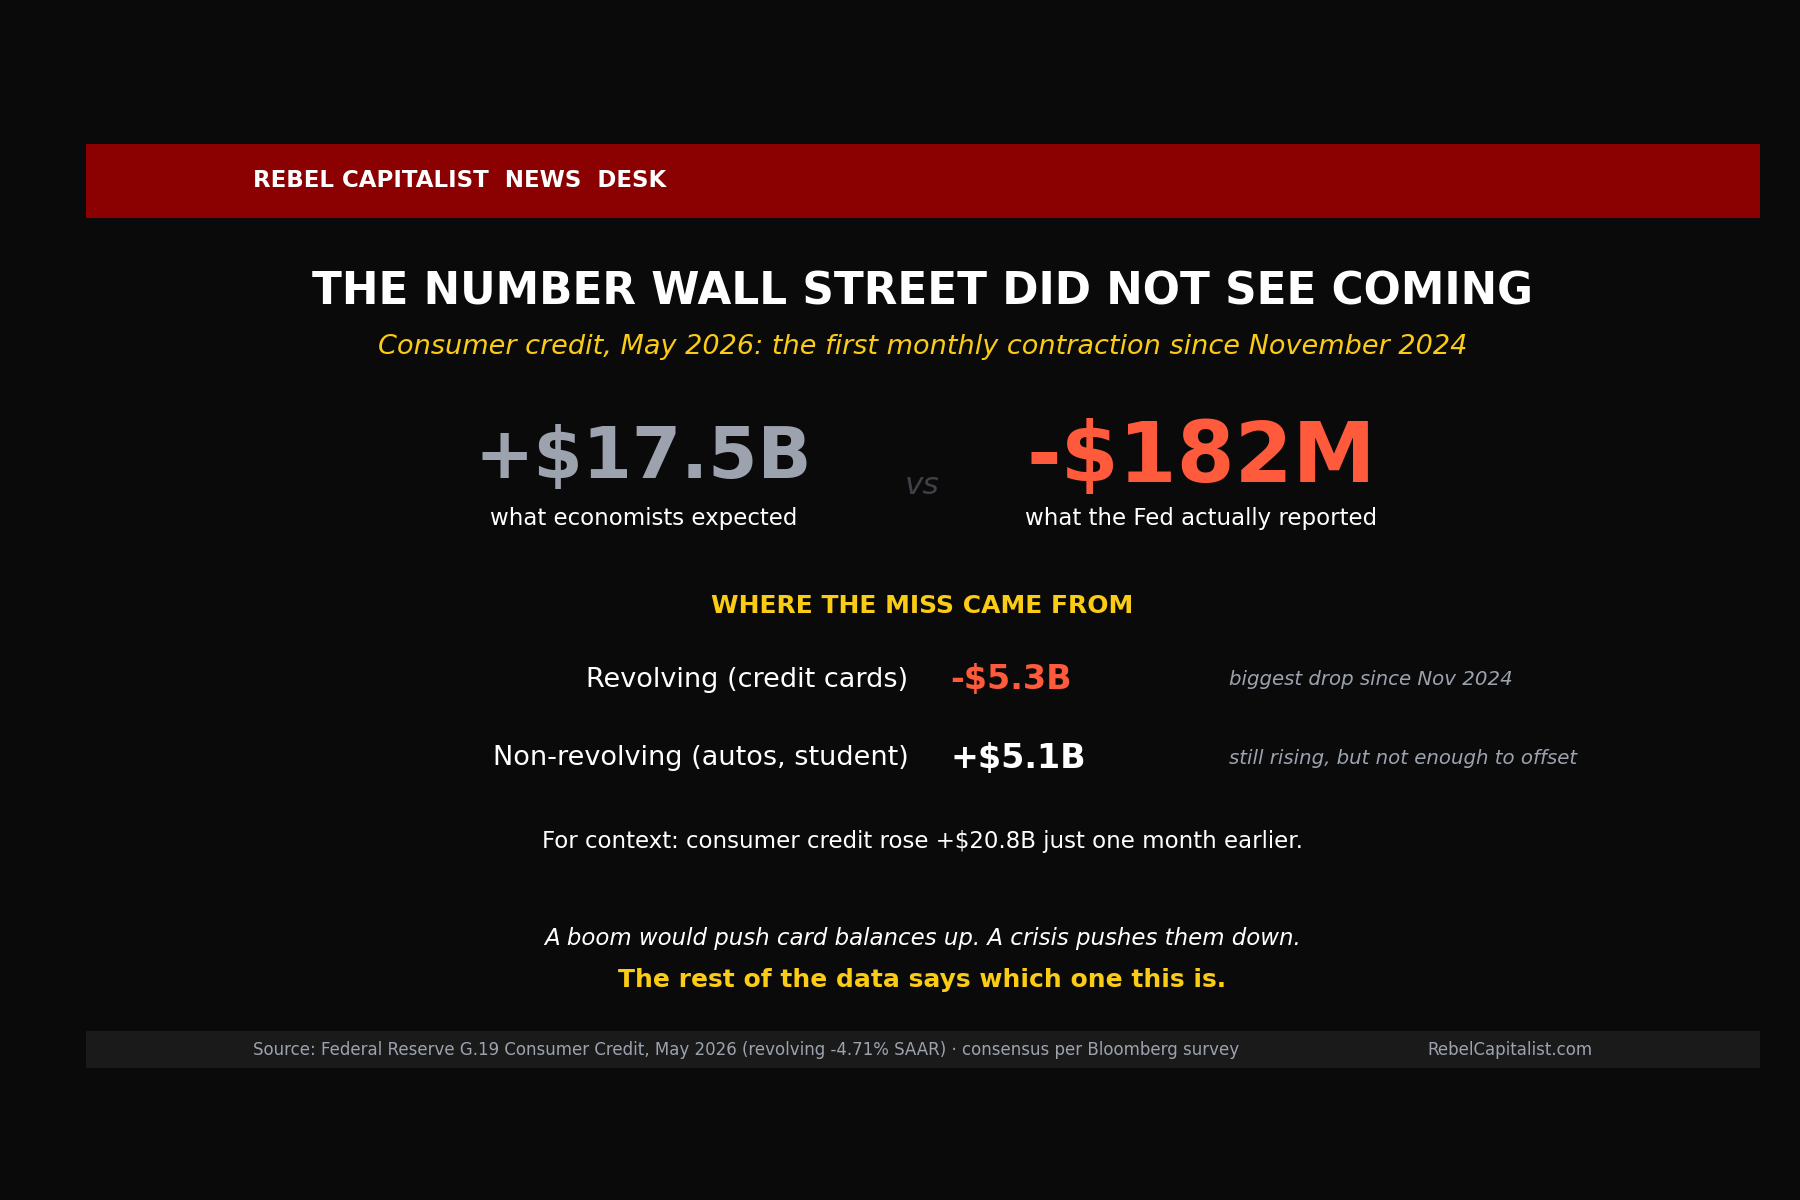
In May, Americans reduced what they owe. Total consumer credit outstanding actually shrank. Wall Street had penciled in an increase of about $17.5 billion, right in line with the $20.8 billion jump the month before. Instead the Federal Reserve’s G.19 report showed the whole thing went into reverse, the first monthly contraction since November 2024.
Turn on financial television and you already know the script. Households are deleveraging. Balance sheets are healing. The consumer is being responsible, paying down those high-rate cards, getting the house in order before the second half of the year. So a pullback in borrowing must mean strength, prudence, a soft landing you can bank on.
It is a tidy story. It is also almost certainly backwards.
Because there are two ways a country’s credit card balances go down. One happens when people are flush and retire some debt. The other happens when people are so far underwater they cannot borrow another dollar, and the balances that vanish are not paid off so much as charged off. Same direction on the chart. Opposite universe underneath.
So which is it? What does the rest of the data say once you stop reading the headline and start reading the fine print?
CONTINUE READING to see the delinquency chart that looks like 2008 all over again, the auto-loan number that just broke a record that stood for two decades, the reason your real cost of living is nowhere near the official inflation rate, and the exact three-signal dashboard that tells you when the last stage of this credit cycle finally arrives. Join us beyond the paywall for this weeks wrap-up and look ahead, if you haven’t done so already.